The Benner Cycle Explained: 150 Years of Market Predictions (2026 Update)
The Benner Cycle is a 150-year-old market timing chart that identifies repeating cycles of crashes, peaks, and buying opportunities. Created by Samuel Benner in 1875, it has correctly predicted roughly 30 of 35 major turning points, including 2007 and 2020. The cycle marks 2026 as the next peak.
Below is the full breakdown — the history, the complete data, where it’s been right, where it’s been wrong, and what it means for investors in 2026.
Who Was Samuel Benner?
Samuel Benner was a prosperous Ohio farmer who was wiped out by the Panic of 1873 — one of the worst financial crises in American history. Rather than walk away, Benner spent years studying why markets crash and recover in patterns.
As a farmer, Benner understood seasonal cycles: weather affects crop yields, which affect supply and demand, which affect prices. He looked deeper and found that these cycles weren’t random — they followed repeating intervals tied to commodity prices and even solar activity.
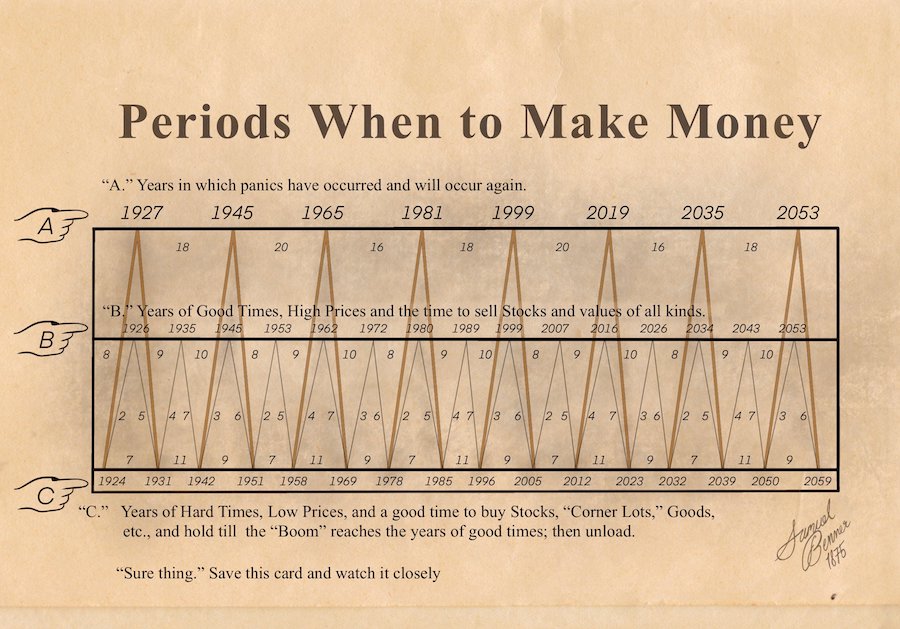
In 1875, Benner published his findings in a book called Benner’s Prophecies of Future Ups and Downs in Prices. The centerpiece was a chart titled “Periods When to Make Money” — a forecast of market panics, peaks, and buying opportunities stretching from the 1870s all the way to 2059.
At the bottom of his original chart, Benner wrote: “Sure thing. Save this card and watch it closely.”
150 years later, the chart is still being watched.
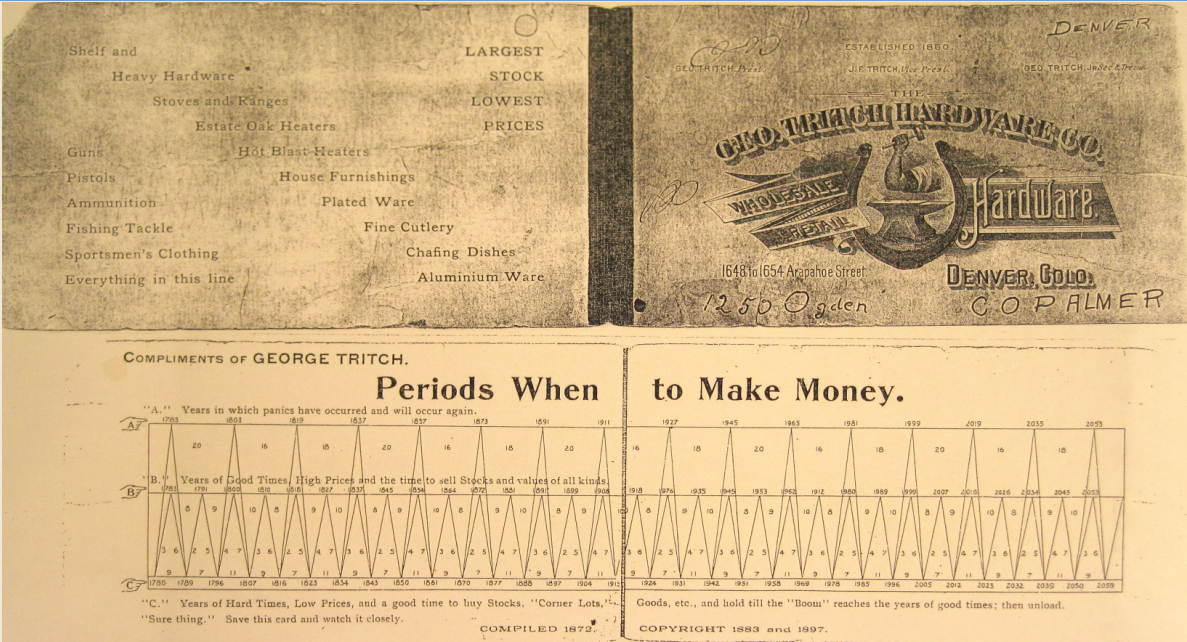 The original “Periods When to Make Money” card by Samuel Benner, distributed by George Tritch Hardware Co. in Denver, Colorado.
Below is an updated, easier-to-read version of the same chart:
Updated Benner Cycle chart by The Rational Investor. The three rows show panic years (A), sell years (B), and buy years (C).
How the Benner Cycle Works
The Benner Cycle divides market history into three repeating phases:
The Three Phases
| Phase | What It Means | Benner’s Advice |
|---|---|---|
| ”A” - Panic Years | Years of irrational market behavior — crashes, bank runs, financial crises | These are the years markets hit bottom |
| ”B” - Good Times | Years of high prices and peak optimism | Sell stocks, assets, and values of all kinds |
| ”C” - Hard Times | Years of low prices, recession, and pessimism | Buy stocks and “hold till the Boom reaches the years of good times, then unload” |
The Repeating Intervals
Benner discovered that these phases don’t occur randomly. They follow specific repeating cycles:
- Panic years repeat on an 16-18-20 year cycle (then restart)
- Good times (peaks) repeat on an 8-9-10 year cycle
- Hard times (bottoms) repeat on a 7-11-9 year cycle
These intervals create a 54-year “super cycle” before the pattern resets — meaning every 54 years, the sequence returns to its starting point.
The Complete Benner Cycle Chart: 1819-2059
Here is every year in the Benner Cycle, from his original predictions through the extended forecast to 2059:
“A” - Panic Years (Market Crashes)
| Predicted Panic Year | Actual Market Event | Accuracy |
|---|---|---|
| 1819 | Panic of 1819 (land speculation collapse) | Hit |
| 1837 | Panic of 1837 (bank failures, 5-year depression) | Hit |
| 1857 | Panic of 1857 (railroad bubble burst) | Hit |
| 1873 | Panic of 1873 (Long Depression began) | Hit |
| 1891 | Panic of 1893 (bank runs, railroad bankruptcies) | 2 years off |
| 1911 | No major panic | Miss |
| 1927 | No panic (but preceded 1929 crash by 2 years) | Close |
| 1945 | Post-WWII recession fears (mild) | Partial |
| 1965 | No panic (strong economy) | Miss |
| 1981 | 1981-82 recession (Volcker rate hikes, 10.8% unemployment) | Hit |
| 1999 | Dot-com bubble peak (NASDAQ crashed 78% by 2002) | Hit |
| 2019 | COVID crash hit Feb-March 2020 | 1 year off |
| 2035 | Future prediction | TBD |
| 2053 | Future prediction | TBD |
Panic year accuracy: ~9 out of 12 historical predictions were correct or within 1-2 years.
”B” - Good Times / Sell Years (Market Peaks)
| Predicted Peak Year | Actual Market Event | Accuracy |
|---|---|---|
| 1926 | Market was indeed rising strongly pre-1929 | Hit |
| 1935 | Mid-Depression rally peak | Partial |
| 1945 | Post-WWII industrial peak | Hit |
| 1953 | 1953 recession followed | Hit |
| 1962 | 1962 Flash Crash (-22% in 3 months) | Hit |
| 1972 | 1973-74 bear market followed (-48%) | Hit |
| 1980 | 1980 recession, gold peaked | Hit |
| 1989 | 1990 recession, Japan bubble burst | Hit |
| 1999 | Dot-com peak (March 2000) | Hit |
| 2007 | October 2007 = exact S&P 500 all-time high before 2008 crash | Hit |
| 2016 | Pre-Trump rally peak, followed by 2018 correction | Partial |
| 2026 | Current prediction: market peak | TBD |
| 2034 | Future prediction | TBD |
| 2043 | Future prediction | TBD |
Peak year accuracy: ~10 out of 11 historical predictions were correct or very close. The 2007 call was nearly perfect.
”C” - Hard Times / Buy Years (Market Bottoms)
| Predicted Bottom Year | Actual Market Event | Accuracy |
|---|---|---|
| 1924 | Market bottom before the Roaring ’20s bull run | Hit |
| 1931 | 1932 was the actual Great Depression bottom | 1 year off |
| 1942 | 1942 was the WWII stock market bottom (exact) | Hit |
| 1951 | Korean War bottom, preceded 1950s bull market | Hit |
| 1958 | 1957 recession bottom | 1 year off |
| 1969 | 1969-70 bear market | Hit |
| 1978 | Pre-1980 recession buying opportunity | Hit |
| 1985 | Mid-1980s bottom before 1987 run-up | Hit |
| 1996 | 1996-2000 was one of the best buying windows in history | Hit |
| 2005 | 2005-2006 was a strong buying opportunity before the peak | Hit |
| 2012 | 2012 was early in the post-2009 bull run | Hit |
| 2023 | October 2022-2023 was a major buying opportunity (S&P rallied 25%+ from Oct 2022 low) | Hit |
| 2032 | Future prediction | TBD |
| 2039 | Future prediction | TBD |
Bottom year accuracy: ~11 out of 12 historical predictions were correct or within 1 year.
Why Does the Benner Cycle Work?
Benner’s original theory was rooted in agriculture:
- The 11-year solar cycle affects crop yields. Benner found this matched an 11-year cycle in corn and pig prices, with peaks every 5-6 years.
- The 27-year pig iron cycle showed price lows every 11, 9, 7 years and peaks every 8, 9, 10 years.
- These agricultural and commodity cycles cascade into the broader economy — affecting revenue, employment, lending, and ultimately stock prices.
Modern validation: NASA forecasts peak solar activity in 2025-2026 with a decline toward 2032 — almost exactly matching the Benner Cycle’s predicted peak-to-trough timing.
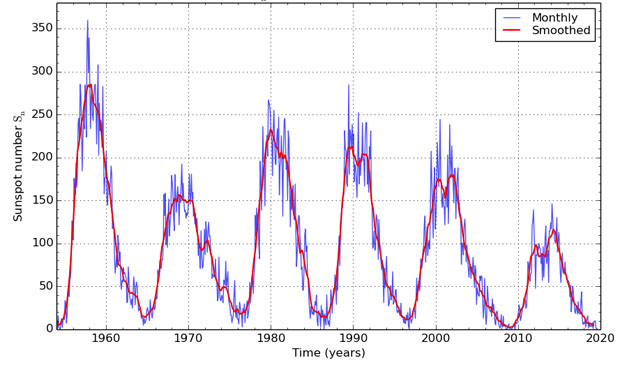 The 11-year solar (sunspot) cycle. Benner linked this to corn and pig price cycles in the 1870s. NASA’s current forecast shows peak solar activity in 2025-2026.
The Skeptic’s View
Critics raise valid points:
- No causal mechanism for modern markets. Today’s economy is services- and software-driven, globally interconnected, and heavily influenced by central banks. The agricultural logic doesn’t directly apply.
- Survivorship bias. We tend to celebrate the predictions that worked and ignore the misses (1911, 1965).
- Pattern-fitting. With enough flexibility (+/- 1-2 years), almost any cycle can appear to “work.”
- Sample size. Even 150 years is a small sample for statistical significance across 16-20 year cycles.
Our take: The Benner Cycle shouldn’t be used as a standalone trading signal. But as one input alongside macro indicators, valuations, and technical analysis, its track record is hard to dismiss entirely. When the Benner Cycle agrees with other signals — like elevated CAPE ratios, inverted yield curves, or extreme sentiment readings — it’s worth paying attention.
What the Benner Cycle Says About 2026-2035
According to the cycle, we’re currently in a critical window:
| Year | Benner Phase | Implication |
|---|---|---|
| 2023 | ”C” - Hard Times (buy year) | October 2022-2023 was a buying opportunity. S&P 500 rallied 25%+ from the October 2022 low. Confirmed. |
| 2026 | ”B” - Good Times (sell year) | The cycle marks 2026 as a market peak — a year to sell stocks and reduce risk. |
| 2032 | ”C” - Hard Times (buy year) | The next major buying opportunity. |
| 2035 | ”A” - Panic Year | The next predicted crash/panic. |
If the Benner Cycle is right about 2026, the current bull market should peak sometime between late 2026 and early 2027, followed by a period of declining prices through the early 2030s.
The 2007 Sell Signal — Benner’s Best Call
The Benner Cycle marked 2007 as a “B” year — Good Times, time to sell. The S&P 500 hit its exact all-time high in October 2007 and then crashed 57% over the next 17 months.
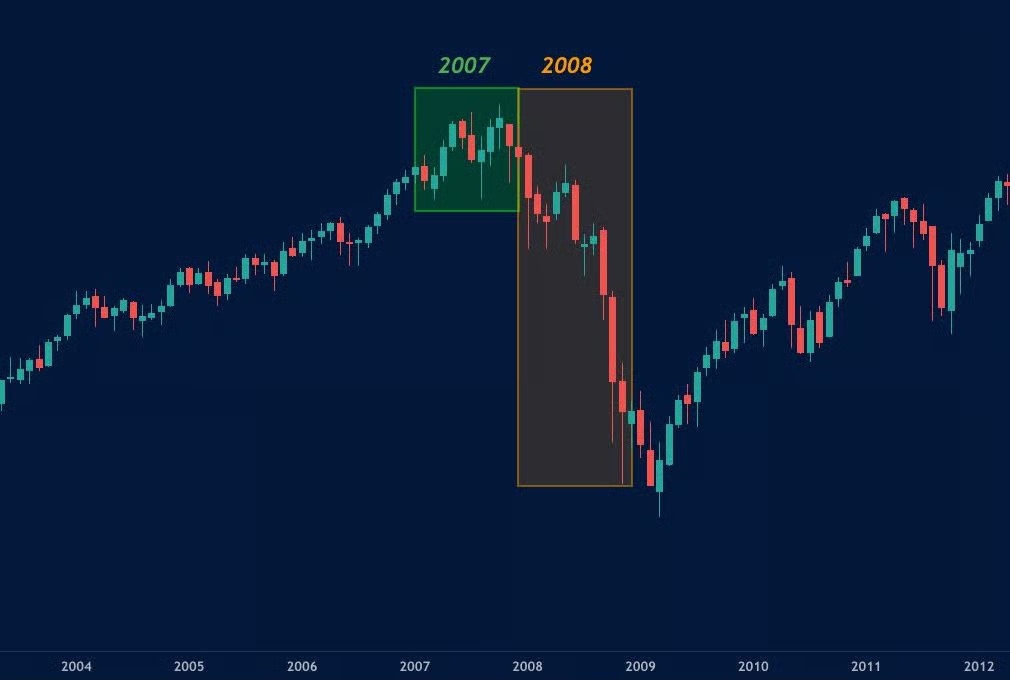 The Benner Cycle’s 2007 sell signal was nearly perfect. The S&P 500 peaked in October 2007 and crashed 57% into the March 2009 low.
The 2019 Panic Call — One Year Early
The cycle predicted 2019 as a panic year. Markets were strong in 2019, but the COVID crash hit in February-March 2020 — just one year late. The S&P 500 dropped 34% in 23 trading days.
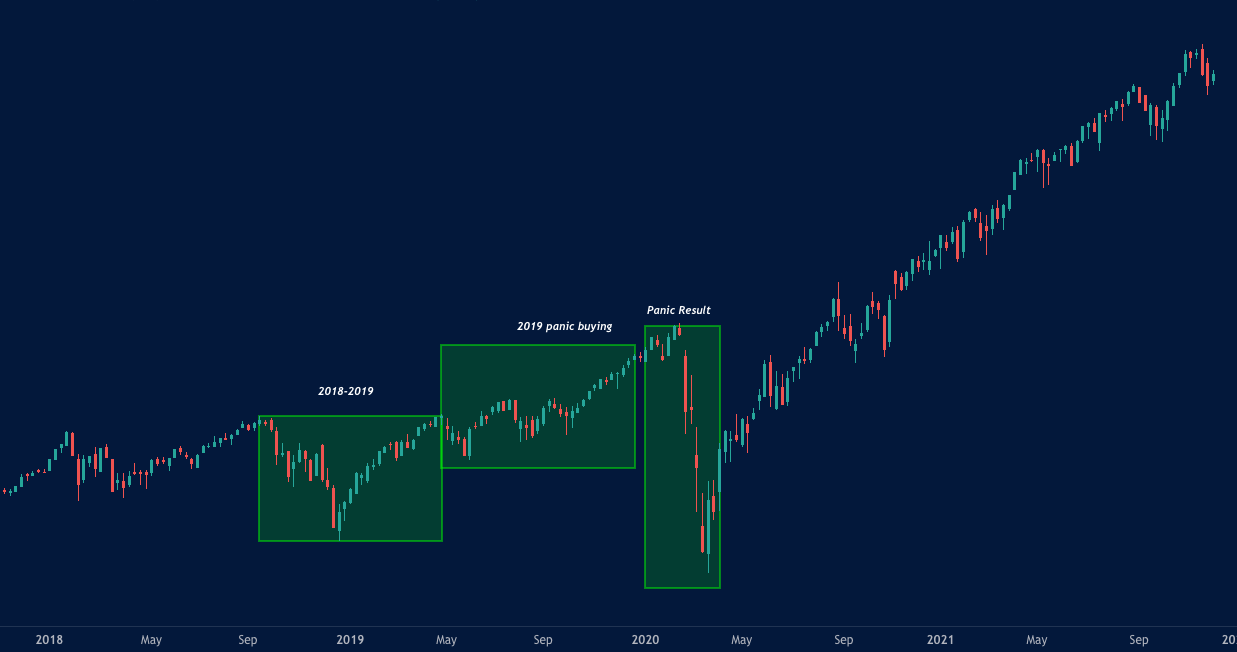 The Benner Cycle predicted a 2019 panic. The actual crash came in early 2020 — one year off, but the direction was right.
This aligns with several other macro signals as of early 2026:
- The S&P 500 CAPE ratio is above 37 (historically elevated)
- The Buffett Indicator (market cap/GDP) is above 200%
- Federal Reserve rate policy remains restrictive
- The 11-year solar cycle is forecast to peak in 2025-2026 before declining
None of this is a guaranteed crash prediction. The Benner Cycle has missed before (1911, 1965), and modern central bank intervention can delay or dampen natural cycles. But when a 150-year-old chart agrees with current macro data, it’s worth having a plan.
How Traders Use the Benner Cycle
The Benner Cycle is a long-term framework, not a day-trading tool. Here’s how serious investors apply it:
During “Good Times” (Sell Years) Like 2026
- Gradually reduce equity exposure
- Take profits on extended positions
- Increase cash and defensive allocations
- Don’t try to time the exact top — reduce risk incrementally
During “Hard Times” (Buy Years) Like 2023 or 2032
- Accumulate quality assets at depressed prices
- Dollar-cost average into broad market positions
- Look for maximum pessimism as a contrarian signal
During “Panic Years” Like 2035
- Expect extreme volatility and irrational selling
- These are historically the best long-term entry points
- But only if you have capital preserved from the sell years
Combining with Other Indicators
The Benner Cycle works best when confirmed by other tools:
- Macro indicators (CAPE ratio, yield curve, unemployment trends)
- Market breadth (advance/decline ratios, percentage above 200-day MA)
- Sentiment (Fear & Greed Index, put/call ratios, VIX levels)
- Cycle analysis (Kondratiev Wave, Presidential Cycle, Bitcoin 4-year cycle)
The Original Benner Cycle Chart
The original “Periods When to Make Money” card was published by George Tritch Hardware Co. in Denver, Colorado. It was compiled in 1872 and copyrighted in 1883 and 1897.
 As one commenter put it: “not bad for 1875 math.”
The card reads:
“A.” Years in which panics have occurred and will occur again.
“B.” Years of Good Times, High Prices and the time to sell Stocks and values of all kinds.
“C.” Years of Hard Times, Low Prices, and a good time to buy Stocks, “Corner Lots,” Goods, etc., and hold till the “Boom” reaches the years of good times; then unload.
“Sure thing.” Save this card and watch it closely.
Frequently Asked Questions
What is the Benner Cycle?
The Benner Cycle is a market timing chart created by Samuel Benner in 1875 that identifies repeating cycles of market panics (crashes), good times (peaks), and hard times (buying opportunities). It uses intervals of 16-18-20 years for panics and 8-9-10 years for peaks, creating a 54-year super cycle. The chart has predicted major market events from 1819 through 2059.
How accurate is the Benner Cycle?
The Benner Cycle has been correct or within 1-2 years on approximately 30 out of 35 historical predictions across its three phases. Notable successes include flagging 1999 and 2007 as sell years (before the dot-com crash and 2008 crisis), 2019/2020 as a panic year, and 2023 as a buying opportunity. Notable misses include 1911 and 1965. During favorable Benner years, the stock market has averaged 11.70% annual returns versus 6.57% during unfavorable years.
What does the Benner Cycle predict for 2026?
The Benner Cycle marks 2026 as a “B” year — a year of Good Times and high prices. According to the cycle, this represents a market peak and an ideal time to sell. The next predicted buying opportunity is 2032, and the next panic year is 2035. This aligns with several elevated macro indicators as of early 2026, including a CAPE ratio above 37 and a Buffett Indicator above 200%.
Is the Benner Cycle related to sunspot cycles?
Yes. Samuel Benner identified an 11-year cycle in corn and pig prices that matched the 11-year solar (sunspot) cycle. His theory was that solar activity affects crop yields, which affects commodity prices, which cascades into the broader economy. NASA’s current solar cycle forecast shows peak activity in 2025-2026 with decline toward 2032, closely matching the Benner Cycle’s timeline.
Should I sell everything because the Benner Cycle says 2026 is a peak?
No. The Benner Cycle should never be used as a standalone trading signal. It’s a long-term cyclical framework — one input among many. It has missed before (1911, 1965), and modern central bank intervention can shift timing. Use it alongside macro indicators, valuations, and your own risk tolerance. If the Benner Cycle and your other indicators are all saying the same thing, that’s when it’s worth paying serious attention.
What is the Benner Cycle’s 54-year super cycle?
Benner discovered that his panic pattern (16-18-20 years) sums to 54 years before resetting. This means the entire sequence of panics, peaks, and bottoms repeats every 54 years. This aligns roughly with the Kondratiev Wave (long economic cycle of ~40-60 years), suggesting both may be measuring the same underlying phenomenon.
Summary
The Benner Cycle is one of the oldest and most successful market timing frameworks in existence. Created by a farmer who lost everything in the 1873 panic, it has correctly identified the majority of major market peaks and crashes for 150 years.
Key takeaways for 2026:
- The cycle marks 2026 as a “Good Times” peak — historically a sell signal
- The next buying opportunity is predicted for 2032
- The next panic year is predicted for 2035
- This aligns with current macro indicators showing elevated valuations
- Never use the Benner Cycle alone — combine it with other analysis
The best way to use the Benner Cycle is alongside a comprehensive set of macro indicators. Tools that track CAPE ratios, yield curves, market breadth, and composite stress scores can help confirm or contradict what the cycle suggests.
Last updated: March 2026
Sources:
- Benner, Samuel. Benner’s Prophecies of Future Ups and Downs in Prices (1875)
- Benner’s Cycle - Wikipedia
- Investing with the Benner Cycle - Quantara Asset Management
- The Benner Cycle, Sunspot Cycles and Recessions - Whaleportal
- Benner Cycle: 90% Success Rate - Pareto Investor
- Benner Cycles & the 9/56 Year Grid - ResearchGate