Bitcoin Halving 2028: Date, Countdown, and the 4-Year Cycle Explained
The next Bitcoin halving is expected around March 2028 at block 1,050,000, when the mining reward drops from 3.125 to 1.5625 BTC per block. Every previous halving has preceded a major bull run, making it the most important event in Bitcoin’s 4-year price cycle.
What Is the Bitcoin Halving?
The Bitcoin halving is a programmed event where the mining reward gets cut in half every 210,000 blocks (roughly every four years). After the April 2024 halving, miners now receive 3.125 BTC per block, down from 6.25 BTC. The next halving at block 1,050,000 will reduce that to 1.5625 BTC.
This matters because it directly controls the supply of new Bitcoin entering the market. With over 19.6 million of the 21 million total BTC already mined (93%+), each halving makes the remaining supply increasingly scarce. Every previous halving has preceded a major bull market.
When Is the Next Bitcoin Halving?
The next Bitcoin halving is estimated for March 26, 2028 at block height 1,050,000. The exact date depends on mining speed (the network targets one block every 10 minutes), so the actual date could shift by a few weeks in either direction.
| Halving | Date | Block Height | Reward Before | Reward After | BTC Price at Halving |
|---|---|---|---|---|---|
| 1st | Nov 28, 2012 | 210,000 | 50 BTC | 25 BTC | ~$12 |
| 2nd | Jul 9, 2016 | 420,000 | 25 BTC | 12.5 BTC | ~$650 |
| 3rd | May 11, 2020 | 630,000 | 12.5 BTC | 6.25 BTC | ~$8,500 |
| 4th | Apr 20, 2024 | 840,000 | 6.25 BTC | 3.125 BTC | ~$64,000 |
| 5th | ~Mar 2028 | 1,050,000 | 3.125 BTC | 1.5625 BTC | TBD |
After the 2028 halving, daily new BTC production will drop from roughly 450 BTC/day to 225 BTC/day.
The Bitcoin 4-Year Cycle Explained
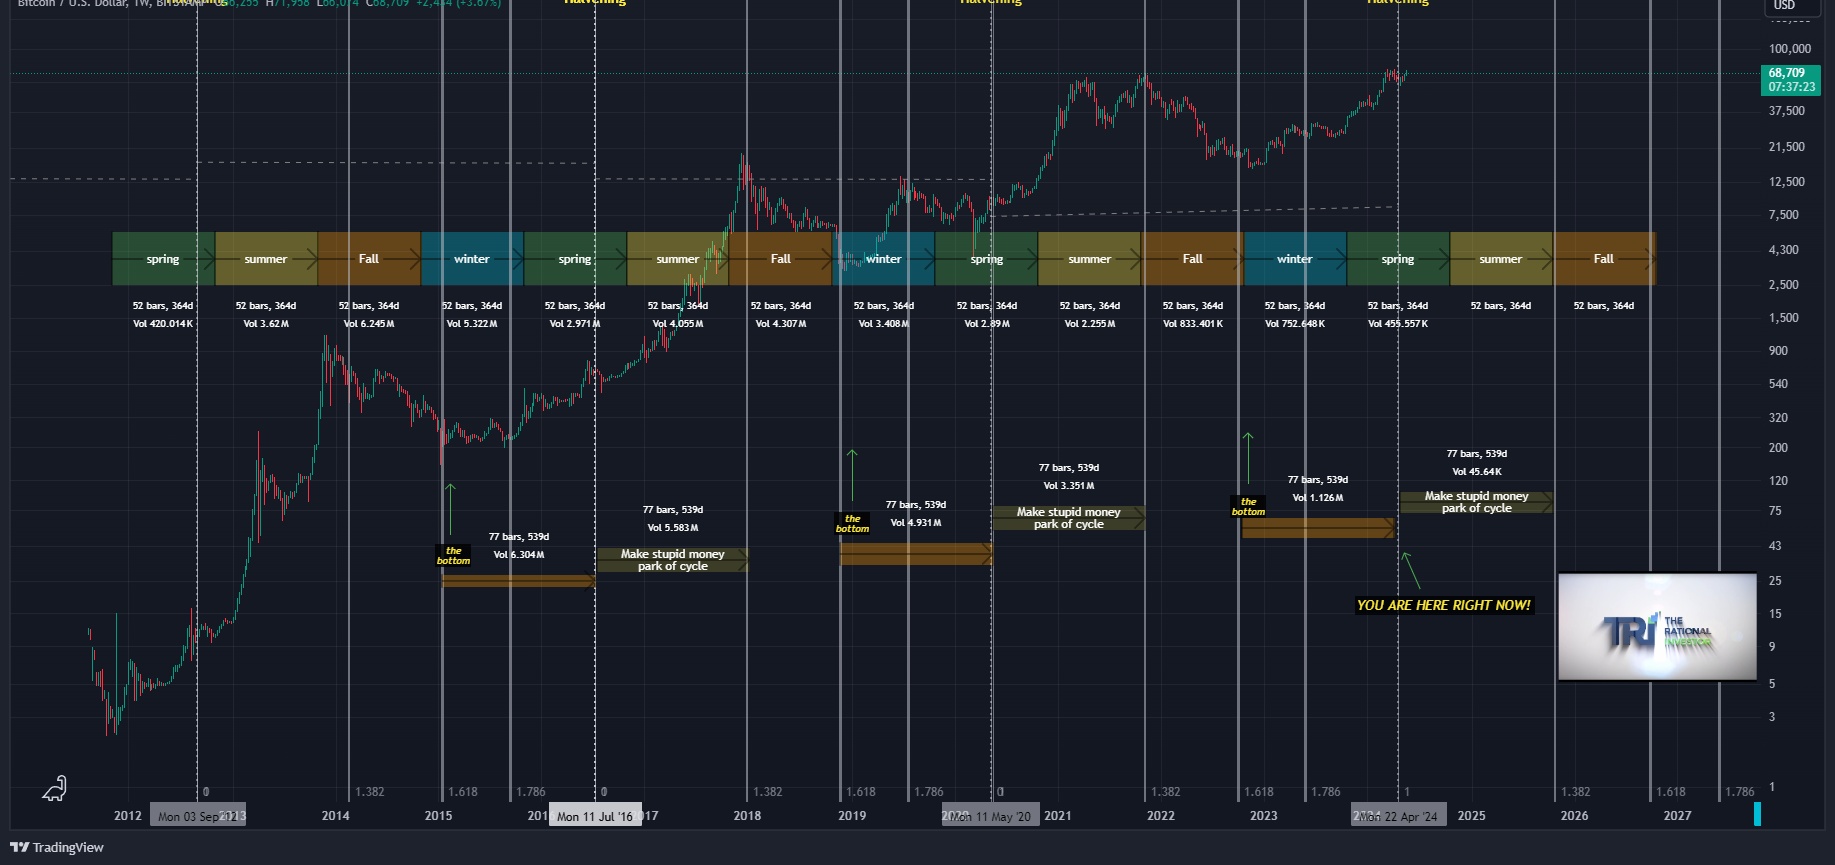
The halving creates a repeating 4-year cycle that has played out with remarkable consistency since Bitcoin’s inception. Each cycle follows four distinct phases, similar to seasons.
The Bitcoin 4-year cycle broken into seasons. Each halving (marked in yellow) kicks off a new cycle. The pattern of bottom, consolidation, blow-off top, and hangover has repeated across every cycle since 2012.
Phase 1: The Bottom (Winter)
This is where Bitcoin’s price hits its cycle low. New traders who entered at the previous peak capitulate and sell at a loss. Historically, BTC tends to bottom near its cost of production, the price at which mining becomes unprofitable. When miners start shutting down because electricity costs exceed revenue, selling pressure dries up and a floor forms.
Each cycle bottom has retraced to approximately the 61.8% Fibonacci level on the log scale:
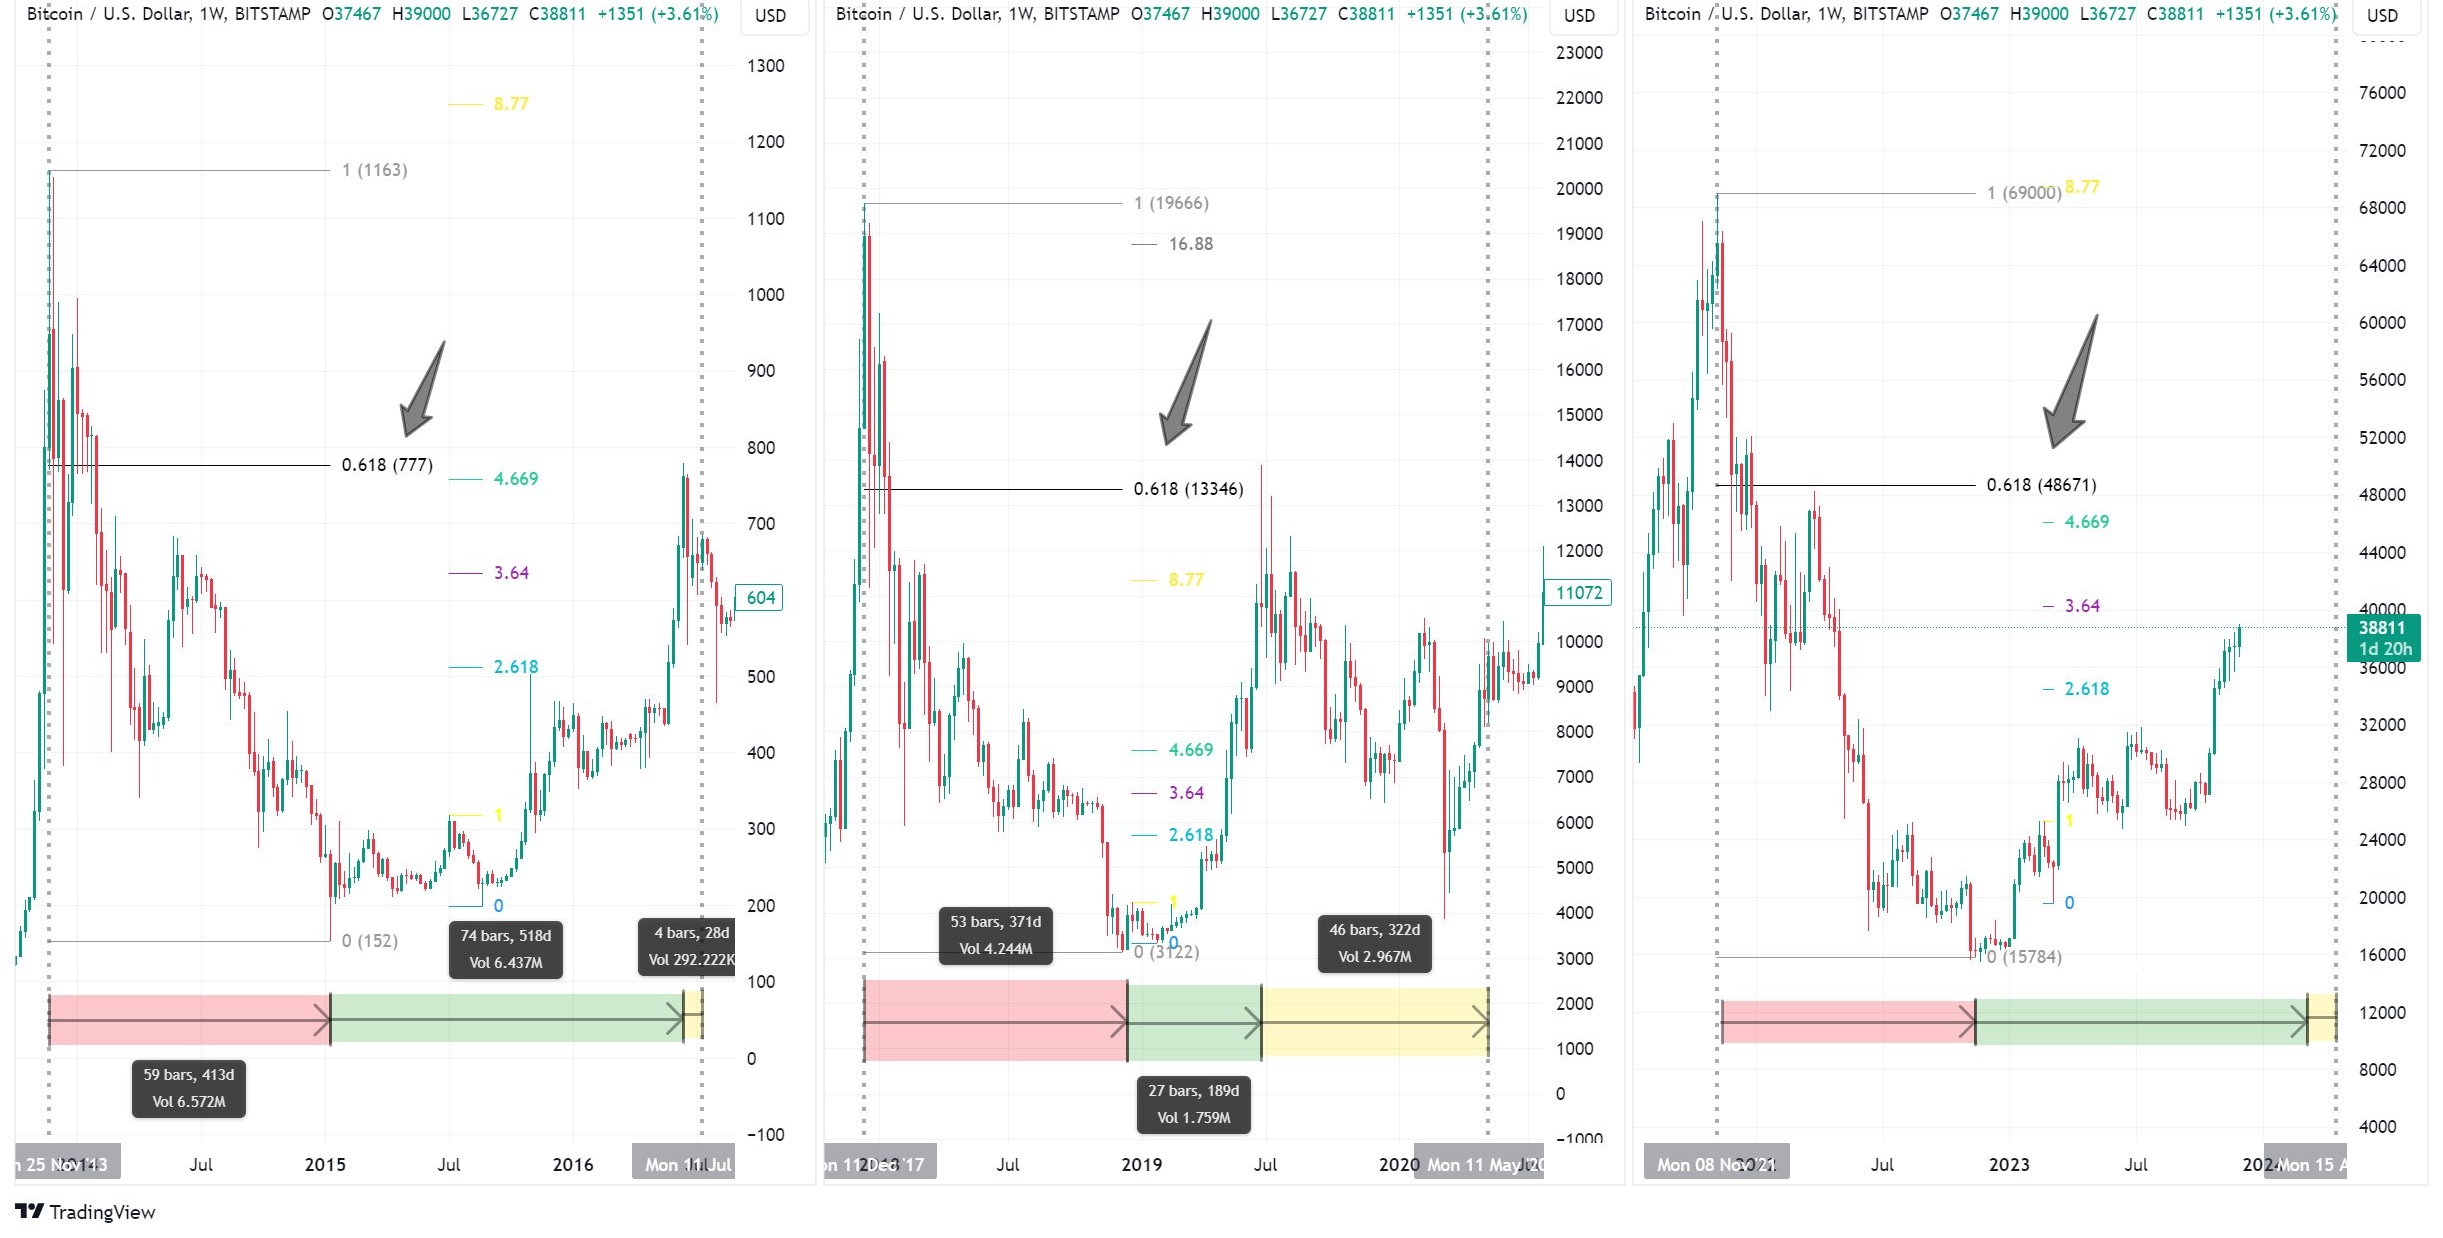
Across three cycles, Bitcoin has consistently bottomed near the 61.8% Fibonacci retracement of the prior move. This level has coincided with the cost of production floor where miners capitulate.
Phase 2: Consolidation (Spring)
After the bottom, Bitcoin enters a recovery phase. Price moves sideways or gradually upward while building a base. The halving typically occurs during this phase, cutting new supply in half just as accumulation builds.
This phase often includes a re-test of the lows or a sharp shakeout that traps late sellers before the next leg up begins.
Phase 3: The Blow-Off Top (Summer)
The explosive phase. Reduced supply from the halving meets growing demand as mainstream attention returns. This is when Bitcoin makes its parabolic moves: $1,100 in 2013, $19,700 in 2017, $69,000 in 2021. This phase is marked by euphoria, media frenzy, and new participants flooding in at elevated prices.
Phase 4: The Hangover (Fall)
After the blow-off top, Bitcoin enters its bear market. Prices drop 70-85% from the peak. The public that bought the top gets washed out. Sentiment shifts from greed to despair. The cycle resets.
Price Returns After Each Halving
Every halving has preceded significant price appreciation, though with diminishing percentage returns as Bitcoin’s market cap grows:
| Halving | Price at Halving | Cycle Peak | Peak Timing | Return to Peak |
|---|---|---|---|---|
| 2012 | ~$12 | ~$1,100 | 12 months after | +9,000% |
| 2016 | ~$650 | ~$19,700 | 18 months after | +2,930% |
| 2020 | ~$8,500 | ~$69,000 | 18 months after | +712% |
| 2024 | ~$64,000 | ~$125,000* | 8 months after* | +95%* |
The 2024 cycle peaked at approximately $124,750 in Q4 2025, roughly 8 months after the halving. BTC has since entered its markdown phase, trading around $68,000 as of March 2026 - a -46% drawdown from the cycle top.
Key pattern: Peaks have historically occurred 12 to 18 months after each halving. The 2024 cycle peaked earlier than previous cycles, likely accelerated by spot ETF inflows. The diminishing returns pattern continues: +95% vs +712% (2020), +2,930% (2016).
Why Does the Halving Affect Price?
The halving reduces the rate of new supply entering the market. With demand constant or growing, reduced supply pushes prices higher. Three mechanisms drive this:
- Direct supply reduction. After April 2024, miners produce ~450 BTC/day instead of ~900. That is roughly $31 million less daily sell pressure at current prices.
- Miner economics shift. When the block reward halves, less efficient miners shut down. The remaining miners, having higher costs, are less willing to sell below their breakeven price, which puts a floor under the market.
- Narrative and attention. Each halving generates media coverage, which brings new buyers. The “supply shock” narrative becomes a self-reinforcing cycle of attention and demand.
The Emotion Cycle
Bitcoin’s 4-year cycle maps almost perfectly onto the classic market emotion cycle of fear and greed. Understanding where you are in the emotional cycle is just as important as understanding the supply cycle.
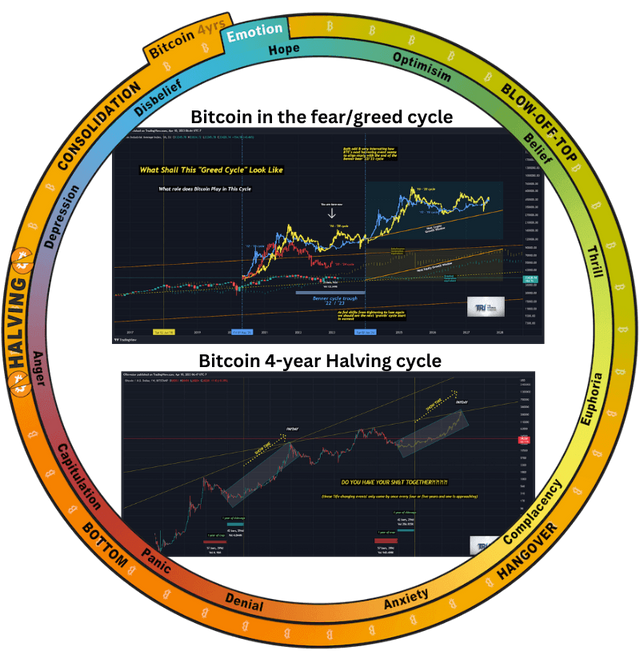
The Bitcoin 4-year cycle overlaid on the market emotion wheel. Halving events occur during the consolidation/hope phase, blow-off tops align with euphoria, and cycle bottoms align with capitulation and panic.
At the top, everyone is talking about Bitcoin. Mainstream media runs “Bitcoin to $1 million” headlines. Your neighbor asks how to buy crypto. At the bottom, the same media runs obituaries. “Bitcoin is dead” trends on social media. This is historically when the best buying opportunities occur.
Where Are We Now? (March 2026)
The cycle has entered its markdown phase. Here’s the current data:
| Metric | Current Reading |
|---|---|
| BTC Price | ~$68,000 |
| All-Time High | ~$124,750 (Q4 2025) |
| Drawdown from ATH | -46% |
| Fear & Greed Index | 8 (Extreme Fear) |
| Days Since Halving | 689 (49% through cycle) |
| 200-Day Moving Average | ~$95,200 (BTC is 29% below) |
Based on the 4-year framework:
| Year | Phase | Status |
|---|---|---|
| 2024 | Consolidation/Spring | Halving occurred April 20. Accumulation built through the year. |
| 2025 | Blow-off top | BTC peaked at ~$125K in Q4 2025. Cycle top confirmed. |
| 2026 | Markdown/Hangover | BTC at ~$68K. Bear market in progress. Extreme Fear readings. |
| 2027 | Bear market bottom | If the cycle repeats, expect the bottom to form mid-to-late 2027. |
| 2028 | Next halving / recovery | Cycle resets around March 2028 halving. Next accumulation zone. |
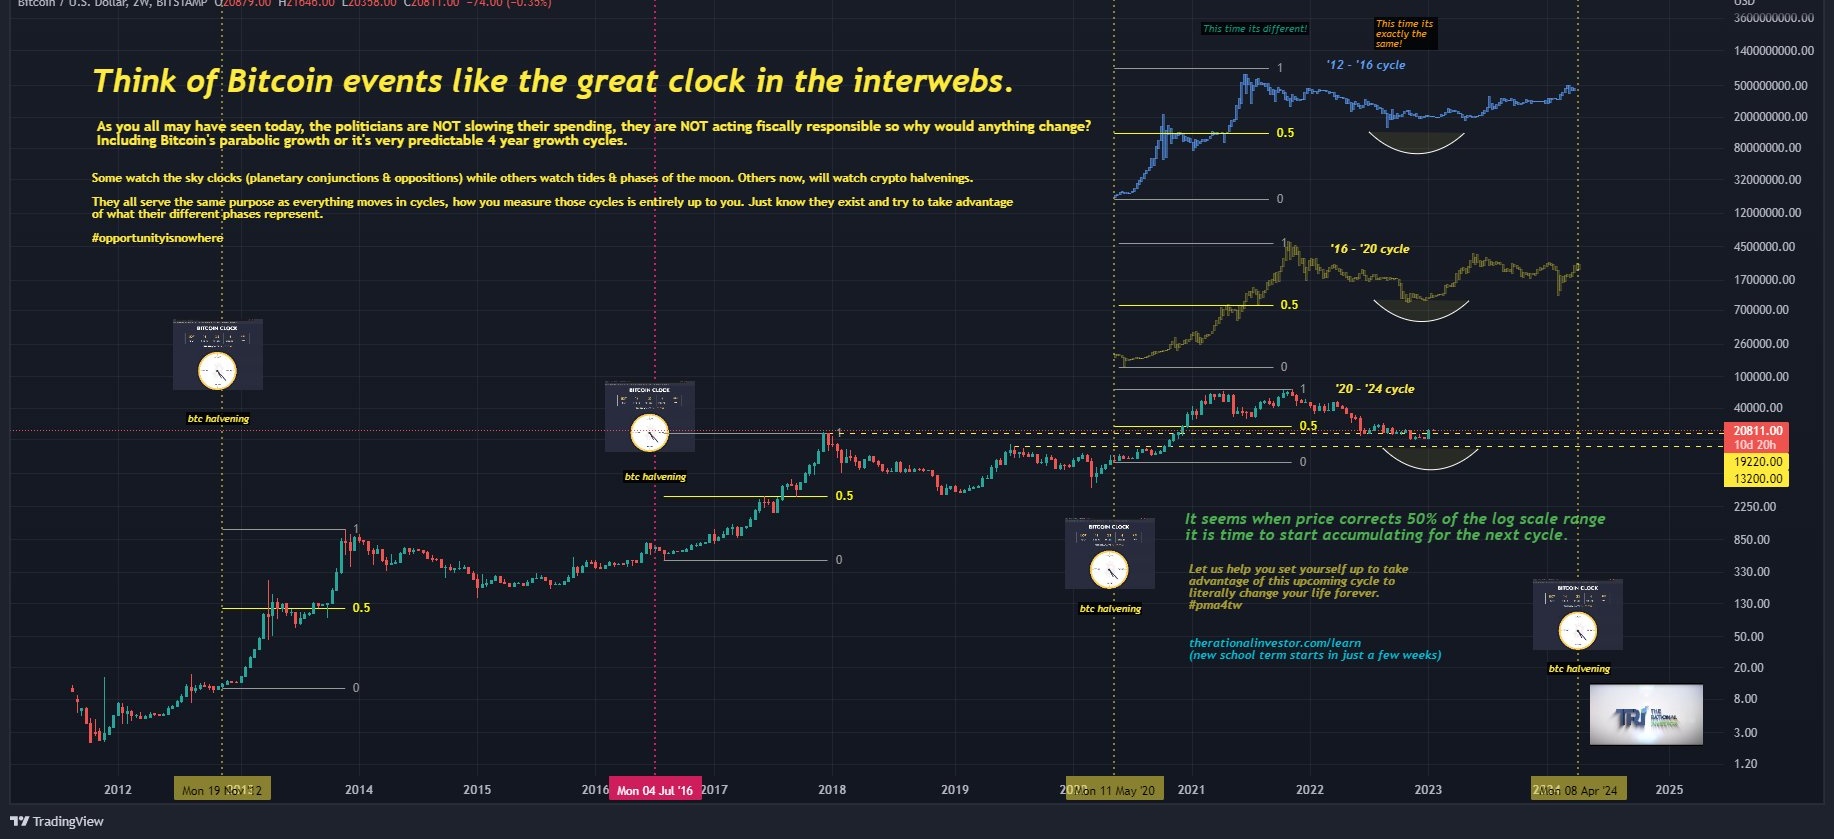
TRI’s 4-year cycle chart showing how Bitcoin corrects to the 50% level on the log scale between cycles, creating accumulation opportunities before each halving.
What the data suggests from here: Historical bear markets have seen drawdowns of 77-87% from the cycle peak. If this cycle follows the diminishing-drawdown pattern, we could see something in the 65-75% range, which would put the bottom around $31,000-$44,000. Our composite scoring model - which tracks Fear & Greed, moving average distance, funding rates, and cycle positioning - currently reads 26/100, consistent with a mid-bear accumulation zone.
The ETF factor is the wild card. Institutional holders may provide a floor that didn’t exist in prior cycles, potentially compressing the drawdown. But even a 50% bear market from $125K puts BTC at $62,000 - not far from current levels.
We track all of this automatically. Our Bitcoin 4-Year Cycle dashboard monitors cycle positioning, composite scoring, and drawdown estimates in real time. TRI members get Discord notifications when cycle phase shifts happen or when our composite score crosses key levels - no need to watch charts every day. The whole point is that you can live your life and only pay attention when the data says it matters. See what’s included -
TRI’s 2023 Warning: “Get Your Sh*t Together”
When Bitcoin was trading around $16,000 in early 2023, TRI published this chart with a clear message: the bottom was forming and the next “show time” phase was approaching.
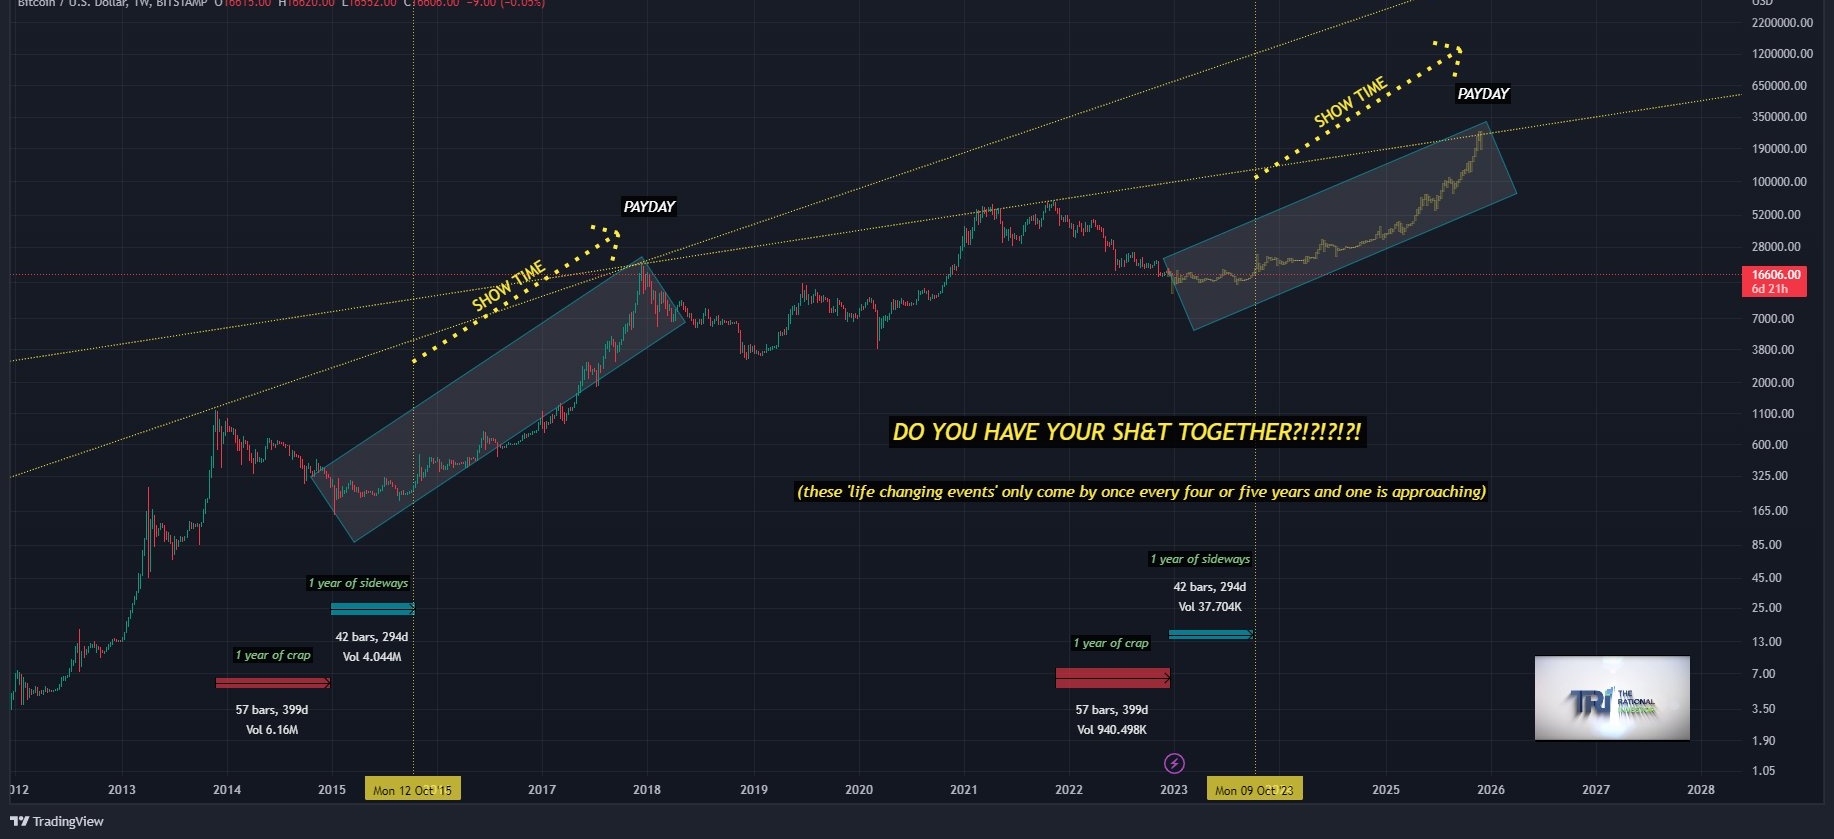
Posted January 2023 when BTC was at $16,600. The chart called the bottom and projected the next “show time” window into 2025-2026. Bitcoin subsequently rallied over 500% to $109,000 by January 2025.
This kind of cycle awareness is exactly what the 4-year framework provides. Not exact price targets, but a sense of where you are in the cycle and what behavior is typical for that phase.
The Bigger Picture: How Bitcoin’s Cycle Connects to Traditional Markets
Bitcoin’s 4-year cycle does not exist in a vacuum. It overlaps with broader macro cycles, including the Benner Cycle (which marks 2026 as a market peak) and generational economic shifts.
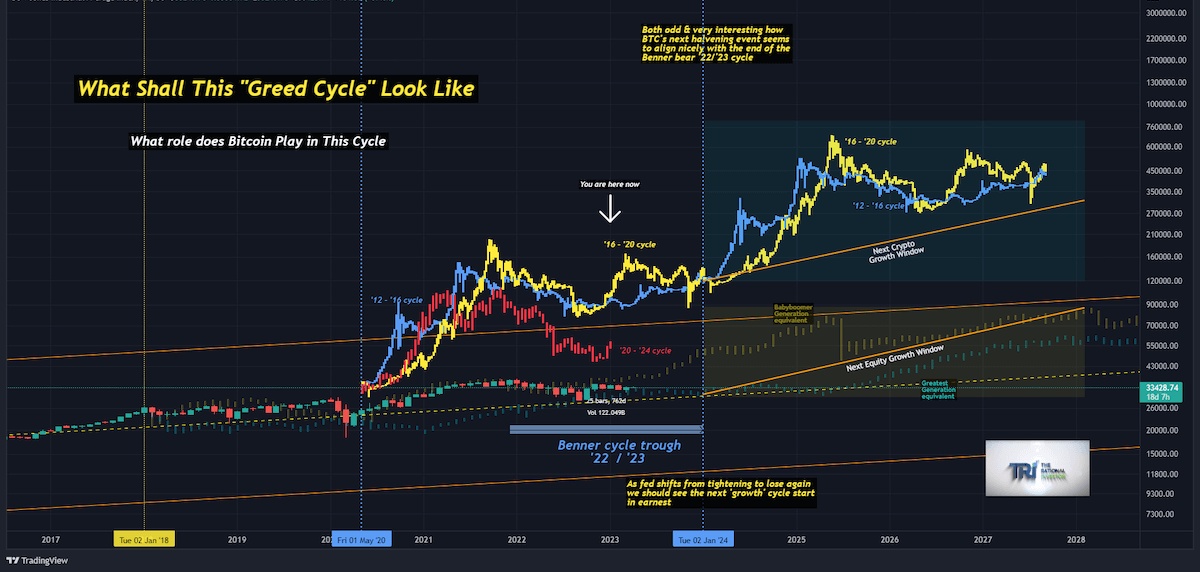
Bitcoin’s cycle overlaid on the Dow Jones and Benner Cycle framework. The Benner trough in 2022/2023 aligned with Bitcoin’s cycle bottom. The next growth window extends through 2025-2026 before the Benner Cycle predicts a decline.
When multiple cycle frameworks agree on timing, the signal becomes more meaningful. The convergence of Bitcoin’s post-halving rally phase with the Benner Cycle’s “good times” window in 2025-2026 was a noteworthy alignment. Whether the blow-off top has already occurred at $109K or a second leg remains is the key question for this cycle.
How to Practically Apply the 4-Year Cycle
The cycle is not a crystal ball. It is a framework for managing risk and positioning:
- Accumulate during the bottom/consolidation phase. Dollar-cost average when sentiment is worst. Don’t try to catch the exact bottom.
- Be patient during consolidation. The months after a halving can be choppy. The big move often takes 12+ months.
- Take profits during euphoria. When everyone around you is talking about crypto, that’s historically been near the top. Reduce exposure incrementally.
- Expect the hangover. Every cycle has ended with a 70-85% drawdown from peak. Position sizing should account for this.
- Combine with other indicators. The 4-year cycle is one input. Pair it with on-chain data, macro indicators, and valuation metrics for a more complete picture.
What the cycle does NOT tell you: Exact prices, exact dates, or what will happen in any individual month. It provides a probabilistic framework based on supply dynamics and historical patterns.
Bitcoin Supply Schedule
Bitcoin’s supply is mathematically fixed. There will never be more than 21 million BTC. The halving schedule ensures that new supply decreases over time:
| Period | Block Reward | New BTC Per Day | % of Total Supply Mined |
|---|---|---|---|
| 2009-2012 | 50 BTC | ~7,200 | 50% |
| 2012-2016 | 25 BTC | ~3,600 | 75% |
| 2016-2020 | 12.5 BTC | ~1,800 | 87.5% |
| 2020-2024 | 6.25 BTC | ~900 | 93.75% |
| 2024-2028 | 3.125 BTC | ~450 | 96.875% |
| 2028-2032 | 1.5625 BTC | ~225 | 98.4% |
As of March 2026, over 19.6 million BTC have been mined, with roughly 1.3 million remaining. An estimated 3 to 4 million BTC are permanently lost (forgotten keys, destroyed wallets), making the effective circulating supply even scarcer.
The last Bitcoin will be mined around 2140, but over 98% will be mined by 2030.
Frequently Asked Questions
When is the next Bitcoin halving? The next Bitcoin halving is expected around March 26, 2028, at block height 1,050,000. The block reward will drop from 3.125 BTC to 1.5625 BTC. The exact date depends on mining speed and could shift by several weeks.
What happens to Bitcoin price after a halving? Every previous halving has preceded a significant price increase, typically peaking 12 to 18 months later. Returns have been: +9,000% (2012), +2,930% (2016), +712% (2020). The 2024 cycle has shown more modest gains so far at roughly +70% to the January 2025 high, consistent with the diminishing returns pattern as Bitcoin’s market cap grows.
Why does the halving matter? The halving cuts new Bitcoin production in half, reducing daily sell pressure from miners. With demand constant or growing, reduced supply tends to push prices higher. It also generates media attention that brings new buyers into the market.
Is Bitcoin’s 4-year cycle still valid? The supply-side mechanics (halving every 210,000 blocks) are permanently encoded in Bitcoin’s protocol and cannot change. However, demand-side dynamics have shifted significantly with institutional adoption, spot ETFs, and derivatives markets. The cycle framework remains useful but should not be treated as guaranteed.
What is Bitcoin’s all-time high? Bitcoin reached approximately $124,750 in Q4 2025, roughly 8 months after the April 2024 halving. As of March 2026, BTC trades around $68,000 - a 46% drawdown from the cycle peak.
How many Bitcoin halvings are left? There will be approximately 29 more halvings after 2028 before the block reward reaches zero around 2140. However, the practical significance diminishes with each one. By 2032, over 98% of all Bitcoin will have been mined.