How to Start Investing in Stocks: A Beginner's Complete Guide (2026)
To start investing in stocks, open a brokerage account, learn position sizing, use a systematic approach with at least a 2:1 reward-to-risk ratio, and never risk more than 1-5% of your total capital on any single trade.
Most new traders lose money in their first year. The difference between those who survive and those who blow up their accounts comes down to two things: risk management and a repeatable process. This guide covers both, whether you are starting with $500 or $50,000.
The Two Rules Every Stock Trader Must Follow
Before you buy a single share, internalize these two rules. They are non-negotiable.
Rule 1: Use a systematic approach with at least a 2:1 reward-to-risk ratio and a 55%+ win rate.
A 2:1 ratio means your average winner is twice the size of your average loser. Combined with a win rate above 55%, the math guarantees long-term profitability even through losing streaks.
Rule 2: Never risk more than 1-5% of your total capital on any single trade.
This is the survival rule. Even a string of 10 consecutive losers (which happens to every trader eventually) only draws down your account by 10-50%, not 100%.
| Metric | Minimum Target | Why It Matters |
|---|---|---|
| Reward-to-risk ratio | 2:1 | Winners outpace losers mathematically |
| Win rate | 55%+ | More than half your trades are profitable |
| Max risk per trade | 1-5% of capital | Survive losing streaks without blowing up |
| Minimum sample size | 30+ trades | Statistical significance before judging results |
These two rules work together. A high win rate means nothing if one bad trade wipes out months of gains. A great risk-reward ratio means nothing if you are risking 50% per trade and get stopped out twice in a row.
Understanding Risk: Two Approaches to the Same 1% Loss
Risk management confuses beginners because the same dollar loss can come from completely different strategies. Here are two examples that both risk 1% of a $10,000 account ($100):
Approach A: Small Position, No Stop Loss
- Invest $100 (1% of capital) in a single stock
- Hold indefinitely with no stop loss
- Worst case: stock goes to zero, you lose $100 (1% of capital)
- Best for: long-term investors, dollar-cost averaging into index funds
Approach B: Large Position, Tight Stop Loss
- Invest $5,000 (50% of capital) in a single stock
- Set a stop loss at 2% below entry
- If stopped out: you lose $100 (1% of capital)
- Best for: active swing traders, momentum strategies
Both approaches risk 1%. But Approach B requires discipline, a tested setup, and the ability to accept being wrong quickly. Approach A requires patience and conviction.
| Factor | Small Position / No Stop | Large Position / Tight Stop |
|---|---|---|
| Capital deployed | 1-5% of account | 20-100% of account |
| Stop loss required? | No | Yes, mandatory |
| Holding period | Weeks to years | Days to weeks |
| Skill level needed | Beginner-friendly | Intermediate to advanced |
| Best for | Index funds, ETFs, blue chips | Swing trading, scanner setups |
| Emotional difficulty | Low (set and forget) | Higher (must accept stops) |
New investors should start with Approach A. It forgives mistakes. You can dollar-cost average into positions, ride out volatility, and learn without the pressure of tight stop losses.
As you gain experience and develop a tested system, you can graduate to Approach B for active swing trading.
Find Your Risk Tolerance Level
Every trader sits somewhere on the risk tolerance spectrum. Where you sit determines your position sizing, holding period, and which strategies suit you best.
| Trader Type | Risk Per Trade | Typical Strategy | Holding Period |
|---|---|---|---|
| Conservative investor | 1-2% | Dollar-cost average into index funds and ETFs | Months to years |
| Position trader | 2-3% | Technical setups on large-cap stocks | 2-8 weeks |
| Active swing trader | 3-5% | Scanner-driven setups with defined stops | 3-10 days |
| Aggressive momentum trader | 5% (max) | Breakout trades with tight stops | 1-5 days |
Key insight: your risk tolerance is not about how much volatility you can stomach emotionally. It is about how much you can lose on a single trade and still execute your next setup without hesitation. If a 3% loss makes you abandon your plan, you are a 1% trader. There is no shame in that.
The most common mistake beginners make is trading too large, too fast. Start at 1% risk per trade. After 30+ trades with consistent execution, consider increasing to 2%.
The 3-Factor Setup Framework
Random trading is gambling. Systematic trading is a business. The difference is having a repeatable process for identifying high-probability setups.
A strong trade setup requires three independent confirmations from different categories. When all three align, the probability of a winning trade increases significantly.
Factor 1: Location (Where Is Price?)
Price location tells you whether a stock is at a level where buyers or sellers are likely to step in.
- Support and resistance zones from previous price action
- Key moving averages (50-day, 200-day)
- Fibonacci retracement levels (38.2%, 50%, 61.8%)
- Volume profile nodes (high-volume areas where price tends to react)
If price is not at a significant level, there is no setup. Move on.
Factor 2: Indicator Confirmation (What Are the Indicators Saying?)
A momentum indicator confirms that buying or selling pressure supports the trade direction.
- RSI divergence (price makes new low, RSI makes higher low = bullish)
- MACD crossover at or near the zero line
- Volume confirmation (increasing volume on the move you want to trade)
- OBV trend (on-balance volume confirming the price direction)
One indicator is not enough. The indicator must confirm what price location is already suggesting.
Factor 3: Market Structure (What Shape Is the Chart Making?)
Market structure provides the pattern context for the trade.
- Higher highs and higher lows (uptrend confirmation)
- W-bottom or double bottom (reversal pattern)
- Head and shoulders (reversal warning)
- Bull/bear flags (continuation patterns)
- Break of structure (trend change confirmation)
How the 3 Factors Work Together
| Factor | What It Answers | Example |
|---|---|---|
| Location | Where should I look? | AAPL pulls back to 50-day MA and previous resistance-turned-support |
| Indicator | Is momentum confirming? | RSI bounces off 40 with bullish divergence |
| Structure | What is the pattern? | Higher low forming within an uptrend, bull flag on daily chart |
| Setup? | All 3 aligned? | Yes: enter long with stop below the recent swing low |
When only one or two factors align, there is no setup. Discipline means waiting for all three. This patience is what separates profitable traders from gamblers.
Choosing a Broker
Your broker is the platform where you buy and sell stocks. Here is what matters for beginners:
| Feature | Why It Matters | What to Look For |
|---|---|---|
| Commission | Affects profitability on small accounts | $0 commission (most major brokers) |
| Fractional shares | Start small without needing full share prices | Available at Fidelity, Schwab, Interactive Brokers |
| Account minimums | Barrier to entry | $0 minimum (most brokers) |
| Order types | Execute your trading plan properly | Market, limit, stop, and stop-limit orders |
| Charting tools | Analyze setups without external software | TradingView integration or built-in charts |
| Account protection | Safety of your capital | SIPC insurance (up to $500K) |
The three most recommended brokers for beginners in 2026 are Fidelity, Charles Schwab, and Interactive Brokers. All three offer $0 commissions, fractional shares, strong charting tools, and SIPC insurance. Choose whichever interface feels most intuitive to you.
Your First 90 Days: A Practical Roadmap
| Week | Action | Goal |
|---|---|---|
| 1-2 | Open a brokerage account, fund with an amount you can afford to lose | Have capital ready |
| 3-4 | Paper trade (simulated) using the 3-factor setup framework | Practice identifying setups without real money |
| 5-6 | Take your first 3-5 live trades at 1% risk per trade | Experience real execution and emotions |
| 7-8 | Review your trading journal, identify what worked and what did not | Build self-awareness |
| 9-10 | Refine your setup criteria based on journal data | Improve your process |
| 11-12 | Complete 20+ trades and calculate your win rate and reward-to-risk | Have data to evaluate your edge |
Critical: Keep a trading journal from Day 1. Record every trade: entry reason, exit reason, risk amount, result, and what you learned. Without a journal, you are guessing. With one, you are building a business.
For a complete guide on building your trading plan and journal, see our step-by-step walkthrough: How to Make a Trading Plan: 7 Steps with a Real Example.
Common Beginner Mistakes (and How to Avoid Them)
| Mistake | Why It Happens | How to Fix It |
|---|---|---|
| Trading too large | Excitement, wanting fast returns | Set 1% max risk per trade, no exceptions |
| No stop loss on active trades | ”It will come back” mentality | If swing trading, stop losses are mandatory |
| Chasing after a big move | FOMO from social media | If you missed the entry, wait for the next setup |
| Averaging down on losers | Ego, unwillingness to take a loss | Only add to winners, cut losers |
| Trading without a plan | Impatience, skipping preparation | Write a plan before placing a single trade |
| Over-trading | Boredom, addiction to action | Set a maximum of 3-5 trades per week initially |
| Ignoring the journal | Laziness, undervaluing the process | Review your journal every Sunday before the new week |
What Separates the Top 10% of Stock Traders
Research from broker data consistently shows that roughly 80-90% of retail traders lose money. The profitable minority shares a few common traits:
- They have a written trading plan with specific rules for entry, exit, and position sizing
- They risk small amounts per trade (1-3% of capital, rarely more)
- They use a systematic approach rather than gut feelings or tips
- They journal every trade and review performance monthly
- They accept losses quickly and let winners run to their target
- They trade less, not more (quality setups only, not daily action)
None of these traits require special intelligence or insider knowledge. They require discipline and consistency.
Frequently Asked Questions
How much money do I need to start investing in stocks?
You can start with as little as $1 using fractional shares on platforms like Fidelity, Schwab, or Interactive Brokers. The amount matters less than the habits you build. Start small, learn the process, and scale up once you have a track record.
Is day trading or swing trading better for beginners?
Swing trading. Day trading requires constant screen time, fast execution, and experience reading intraday price action. Swing trading lets you analyze charts in the evening, place orders before the market opens, and check positions once or twice a day. It is compatible with a full-time job.
How many trades should I take per week?
Quality over quantity. Most successful swing traders take 3-7 setups per week. If you cannot find a setup that meets all three factors (location, indicator confirmation, market structure), do not force a trade. Cash is a position.
What is the difference between investing and trading?
Investing is buying and holding assets for months to years, usually with minimal position management. Trading is actively buying and selling over days to weeks, using technical analysis and defined risk rules. Both can be profitable. This guide focuses on active swing trading, but the risk management principles apply to both.
Do I need to watch the market all day?
No. Swing trading requires 15-30 minutes per day, typically after the market closes. You scan for setups, place your orders (including stop losses), and let the market do its thing. If you find yourself watching every tick, you are either trading too large or you do not trust your setup.
What stocks should beginners trade?
Start with large-cap stocks in the S&P 500. They have high liquidity (tight bid-ask spreads), extensive analyst coverage, and lower volatility than small-caps. Avoid penny stocks, OTC stocks, and anything with less than 500,000 shares average daily volume.
Next Steps
- Open a brokerage account if you do not have one (Fidelity, Schwab, and Interactive Brokers all offer fractional shares and strong platforms)
- Read our trading plan guide to build your written plan before taking any trades: How to Make a Trading Plan
- Start a trading journal from your very first paper trade
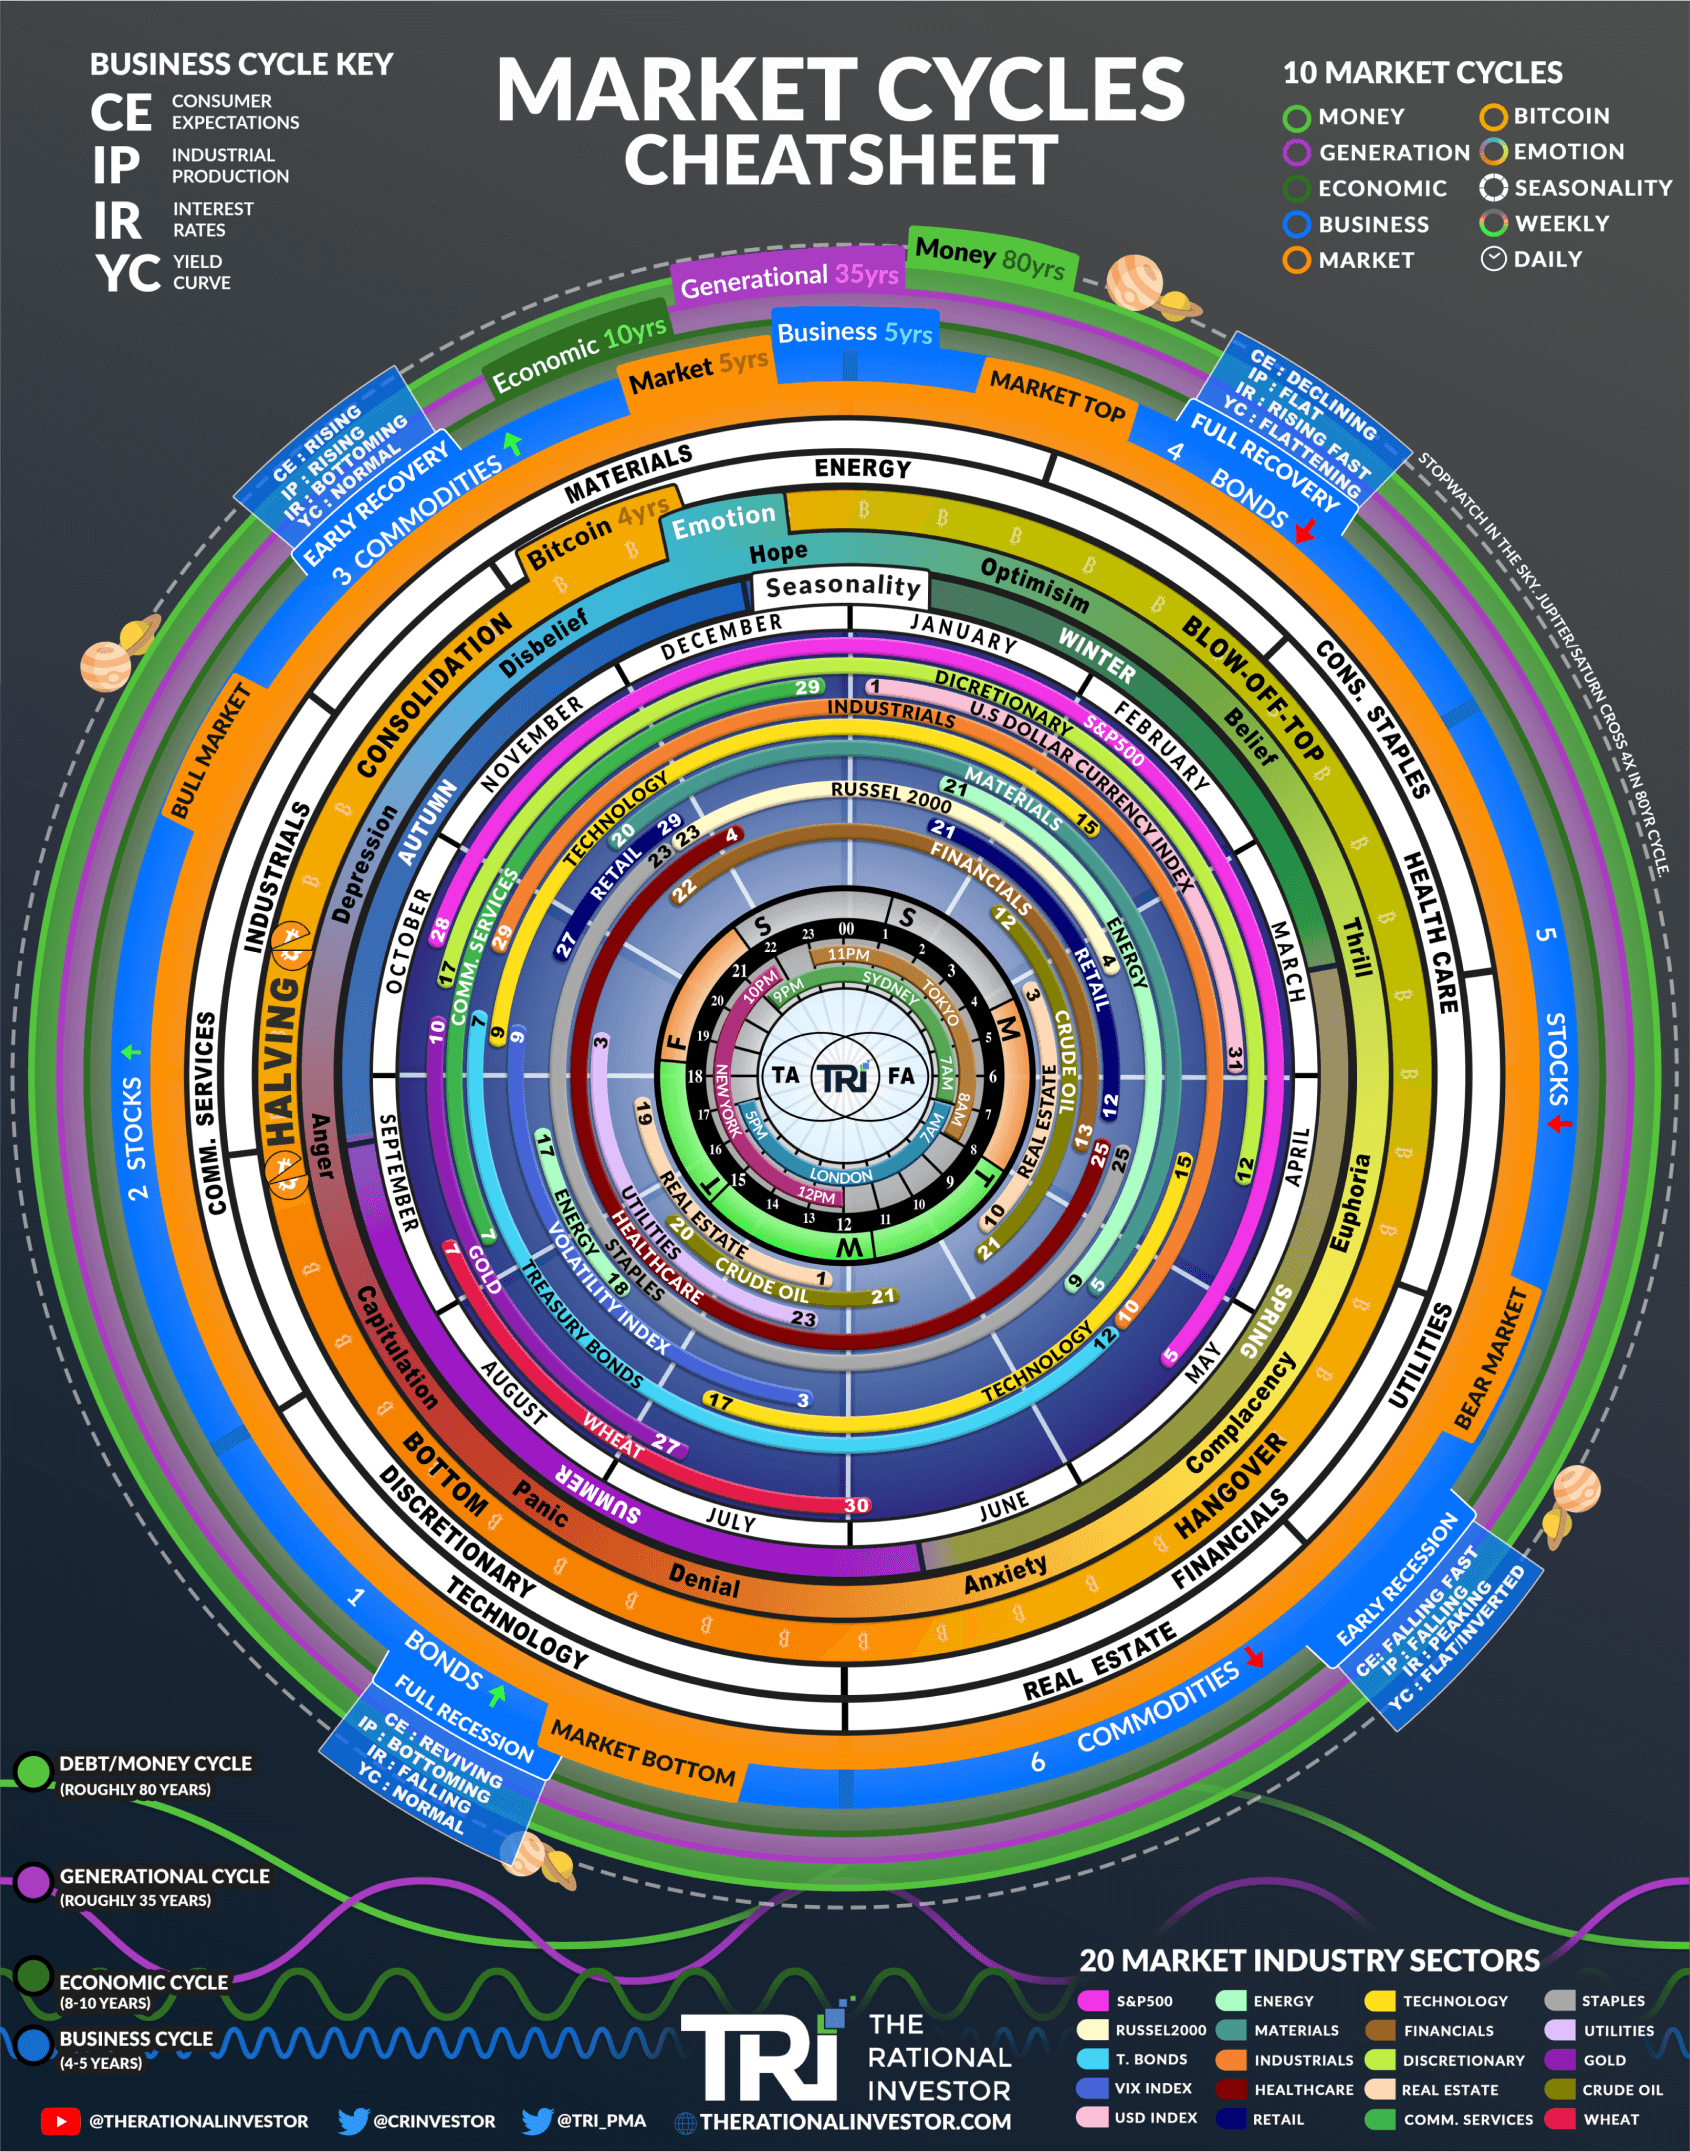
- Learn about market cycles so you understand the broader context your trades happen in: 10 Market Cycles Every Trader Should Know
- Join the TRI community for daily market briefs and scanner recaps: Join Free
This guide is for educational purposes only. All trading involves risk. Past performance does not guarantee future results. Never invest money you cannot afford to lose.