The January Barometer: Does It Actually Work? (2022-2026 Case Studies)
The January Barometer is a stock market indicator stating that the S&P 500’s January performance predicts the full year’s direction. Since 1938, it has maintained a 75-80% accuracy rate, making it one of the most reliable single-month market indicators.
What Is the January Barometer?
The January Barometer is a market theory stating that the S&P 500’s performance in January predicts its direction for the rest of the year. If January closes positive, the market tends to finish the year higher. If January closes negative, expect a weak or down year. The theory was created by Yale Hirsch in the 1972 Stock Trader’s Almanac and has maintained a 75-80% accuracy rate over 85+ years of data.
The logic: January is when institutional investors rebalance portfolios, deploy fresh capital allocations, and set their outlook for the year ahead. This concentrated capital flow in the first month acts as a microcosm of the forces that will drive markets for the next 11 months.
How Accurate Is the January Barometer?
The data is surprisingly strong. According to the Stock Trader’s Almanac, the January Barometer has the highest predictive accuracy of any single-month indicator across the S&P 500, Dow Jones, and Nasdaq.
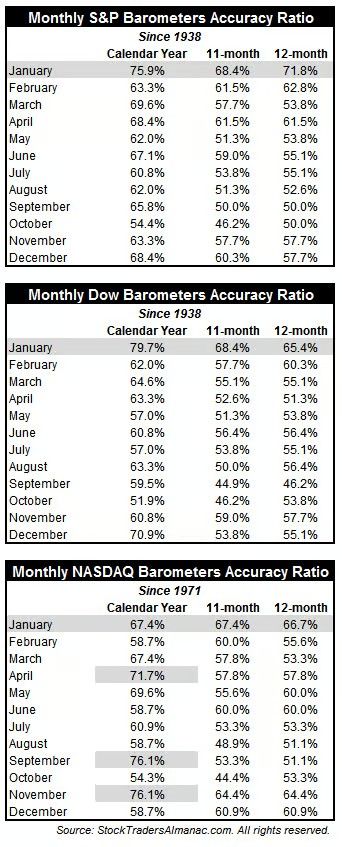
Monthly barometer accuracy ratios since 1938 (S&P and Dow) and 1971 (Nasdaq). January leads all months across all three indexes. A positive January correctly predicted a positive year 75.9% of the time for the S&P 500 and 79.7% for the Dow. Source: Stock Trader’s Almanac.
| Index | January Accuracy (Calendar Year) | January Accuracy (Next 11 Months) |
|---|---|---|
| S&P 500 | 75.9% | 68.4% |
| Dow Jones | 79.7% | 68.4% |
| Nasdaq | 67.4% | 67.4% |
Since 1950, the January Barometer has produced only about 12 significant errors. That does not mean it is a crystal ball. It means January’s direction has been a statistically meaningful signal for the full-year trend roughly three out of four times.
Why Does the January Barometer Work?
Three forces explain why January sets the tone:
-
Institutional capital deployment. Pension funds, mutual funds, and endowments receive annual allocations in January. Where they put this money reveals their macro outlook for the year.
-
Portfolio rebalancing. Large investors lock in profits before year-end for tax and reporting purposes, then re-establish positions in January. The net direction of this activity signals conviction.
-
Fractal time structure. Markets are fractal. The first day often mirrors the first week. The first week mirrors the first month. The first month mirrors the year. This pattern is observable across multiple timeframes and is consistent with how institutional money flows cascade through the market.
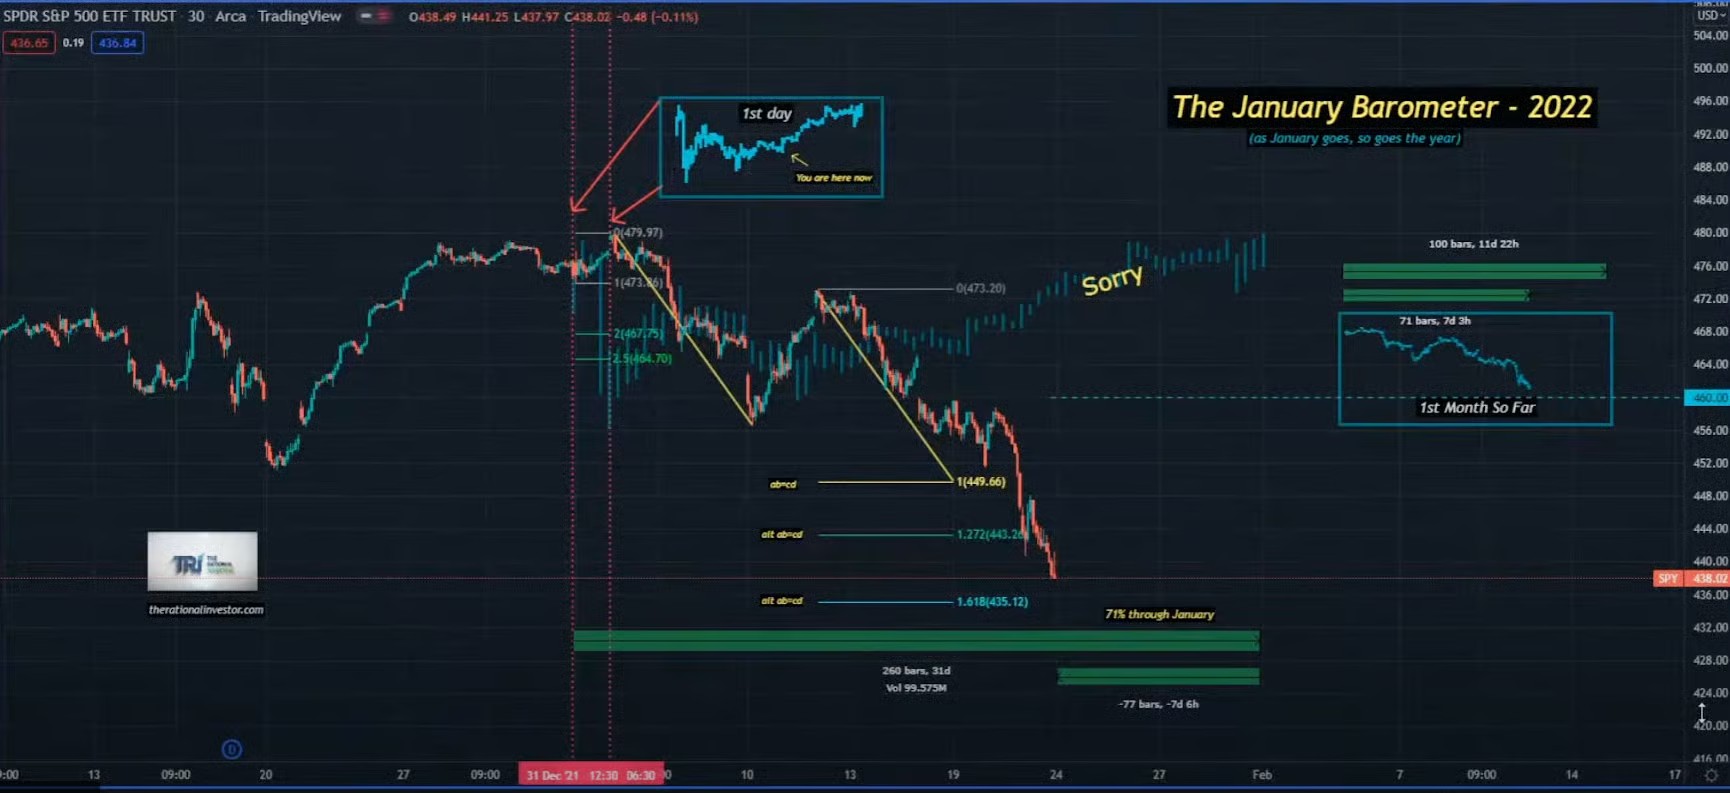
Case Study: 2022 (Bearish January, Bearish Year)
January 2022 was brutal. The S&P 500 fell roughly 5.3% in January, its worst start since 2009. The Fed was signaling aggressive rate hikes, and the market was heavily overextended after the 2020-2021 stimulus rally.
The January Barometer prediction: Bearish year ahead.
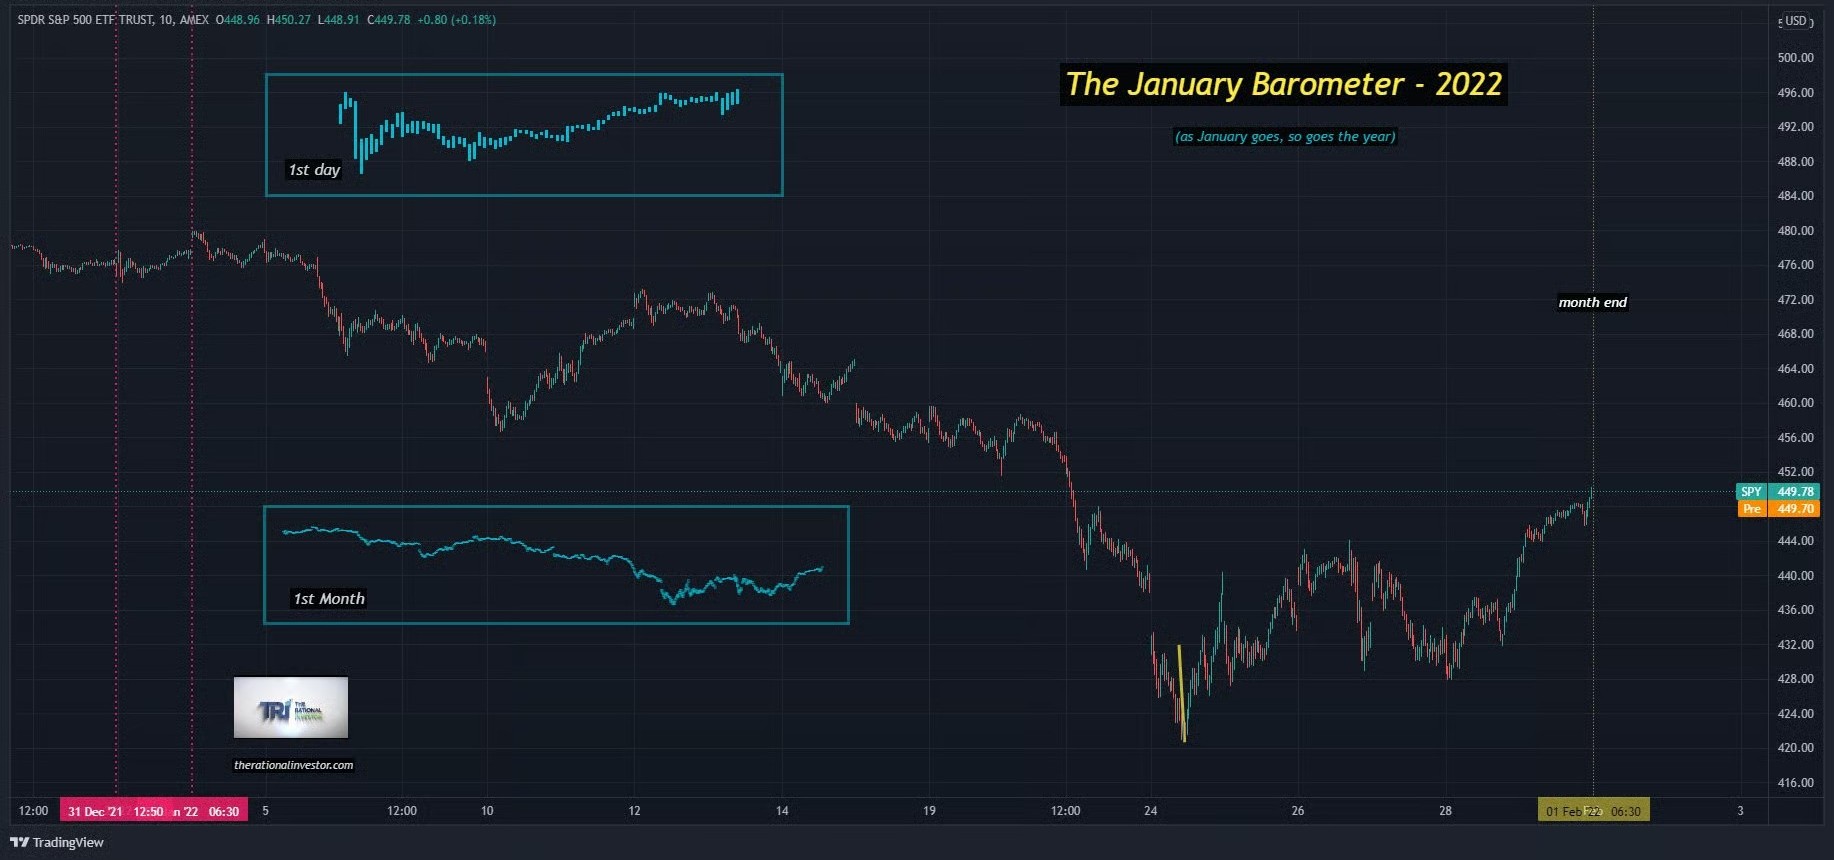
TRI’s 2022 January Barometer showing the bearish first day and first month. The market went on to decline roughly 20% from January through October 2022, confirming the barometer’s bearish signal.
The January signal laid out multiple scenarios for the year:
The 2022 January Barometer in real time. The bearish January projected Fibonacci targets at 450, 443, 436, and 427 on SPY. The market hit them all during the year.
What actually happened: The S&P 500 fell 19.4% in 2022 (its worst year since 2008). The January Barometer nailed it.
The 2022 Midterm Election Connection
2022 was also a midterm election year, which has its own seasonal pattern. Midterm years historically show weakness in the first half, a bottom around June-October, and a rally into year-end.
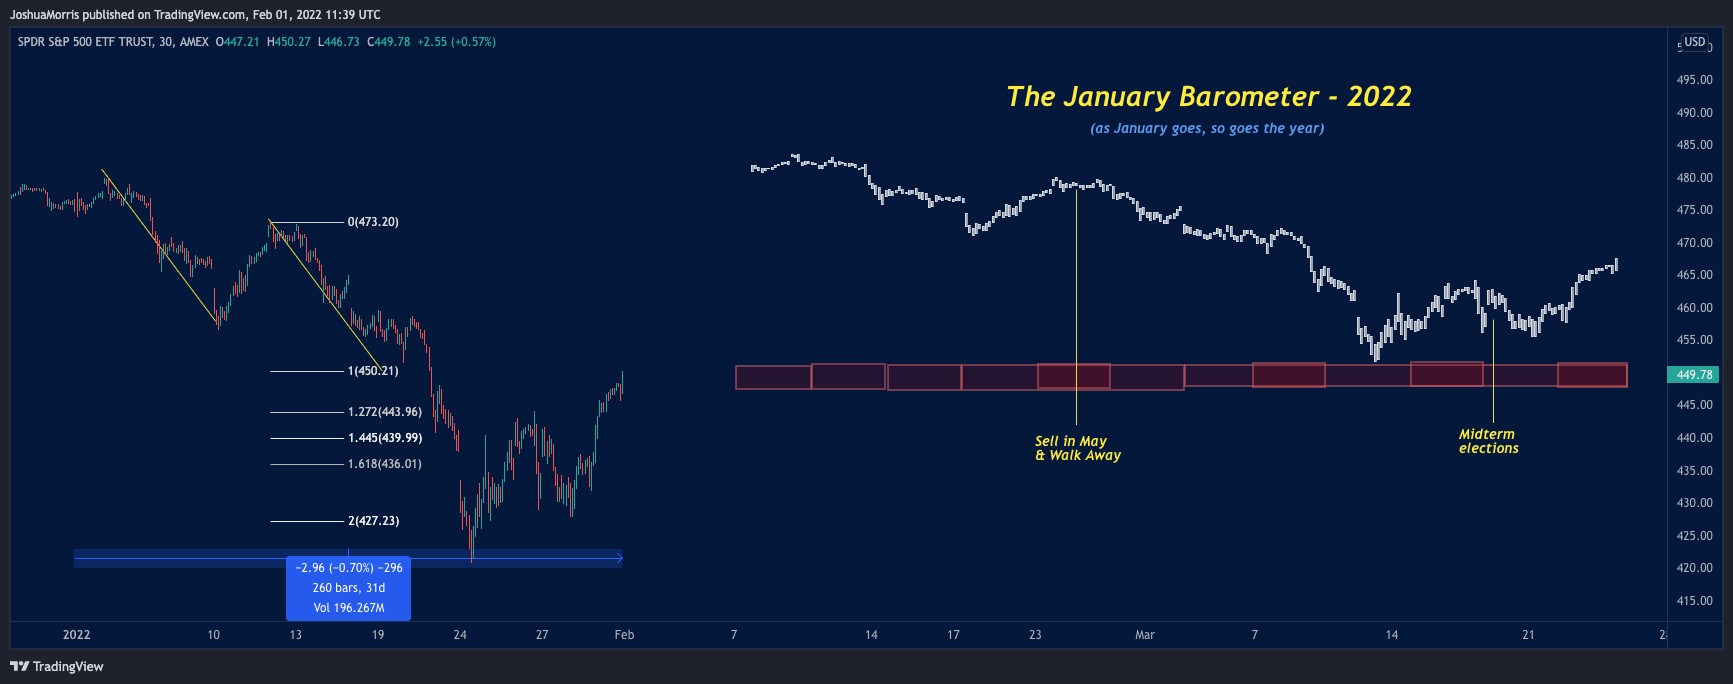
The 2022 January Barometer combined with the “Sell in May” seasonal pattern and midterm election timing. The June/July pivot and November election aligned with the barometer’s projection of a weak first half and recovery in the second half.
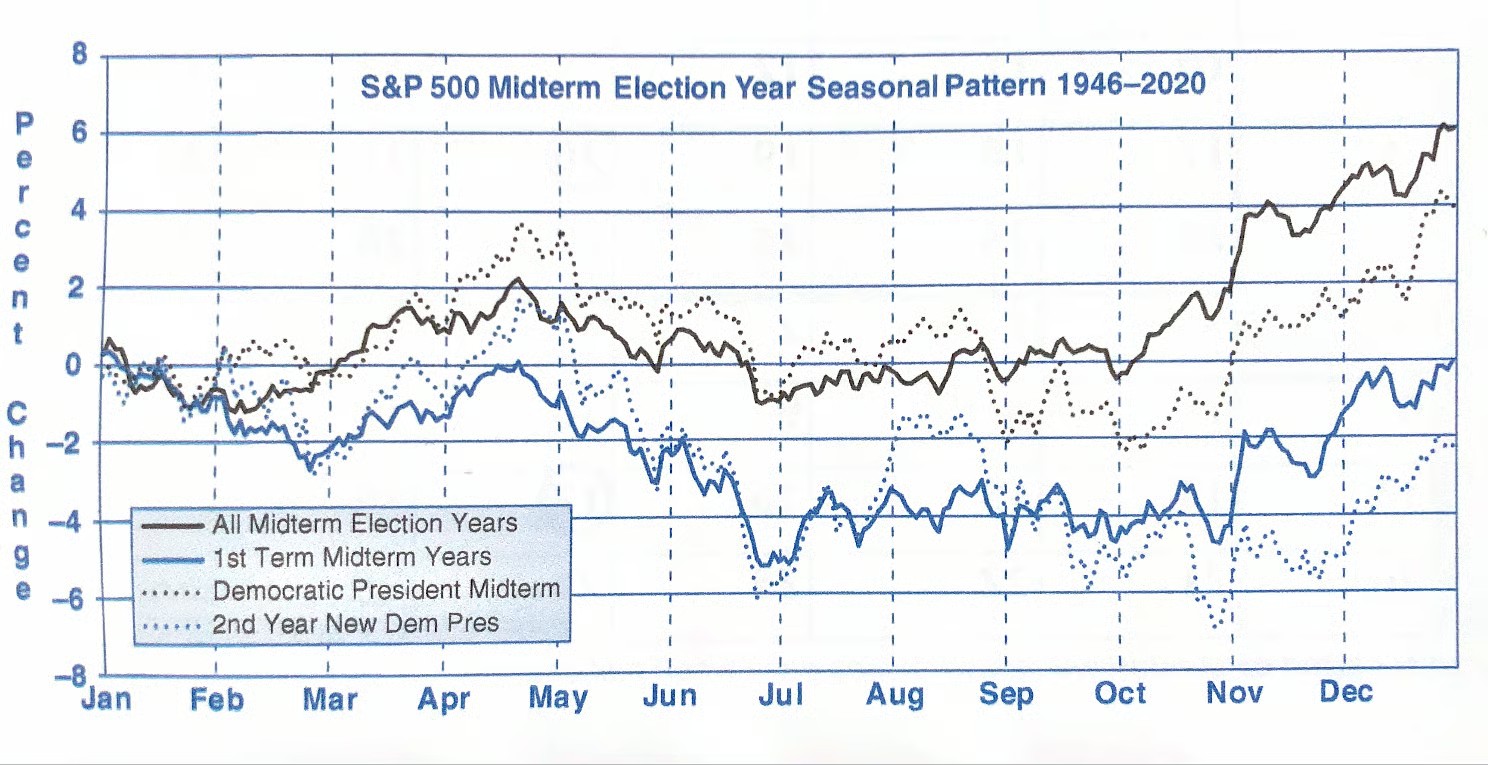
The midterm election year seasonal pattern (1946-2020). The blue dotted line (Democratic president midterm) closely matched the actual 2022 path: weakness through September, a bottom in October, and a rally into year-end.
The 2022 S&P 500 bottomed on October 13, then rallied into year-end. The January Barometer’s bearish signal, combined with the midterm election seasonal pattern, provided a useful framework for the entire year.
Decennial Pattern Confirmation
The S&P 500 also followed the decennial pattern in 2022, with years ending in “2” historically producing choppy, range-bound markets.
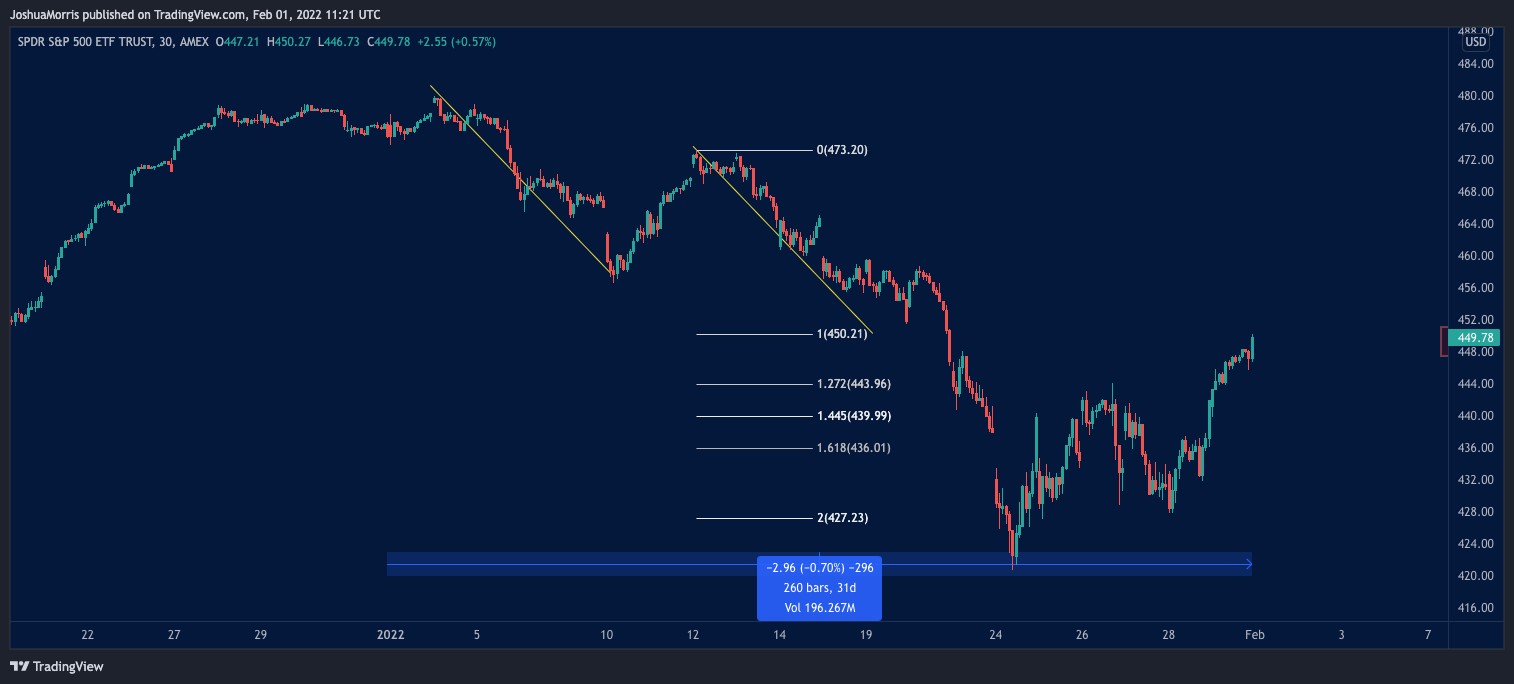
The Fibonacci extension from January’s decline projected the key support levels for the year. The 1.618 extension at 436 and the 2.0 extension at 427 were both hit during the October bottom.
Case Study: 2023 (Bullish January, Bullish Year)
After the 2022 bear market, January 2023 posted a gain of roughly 6.2% on the S&P 500. This was the strongest January since 2019.
The January Barometer prediction: Bullish year ahead.
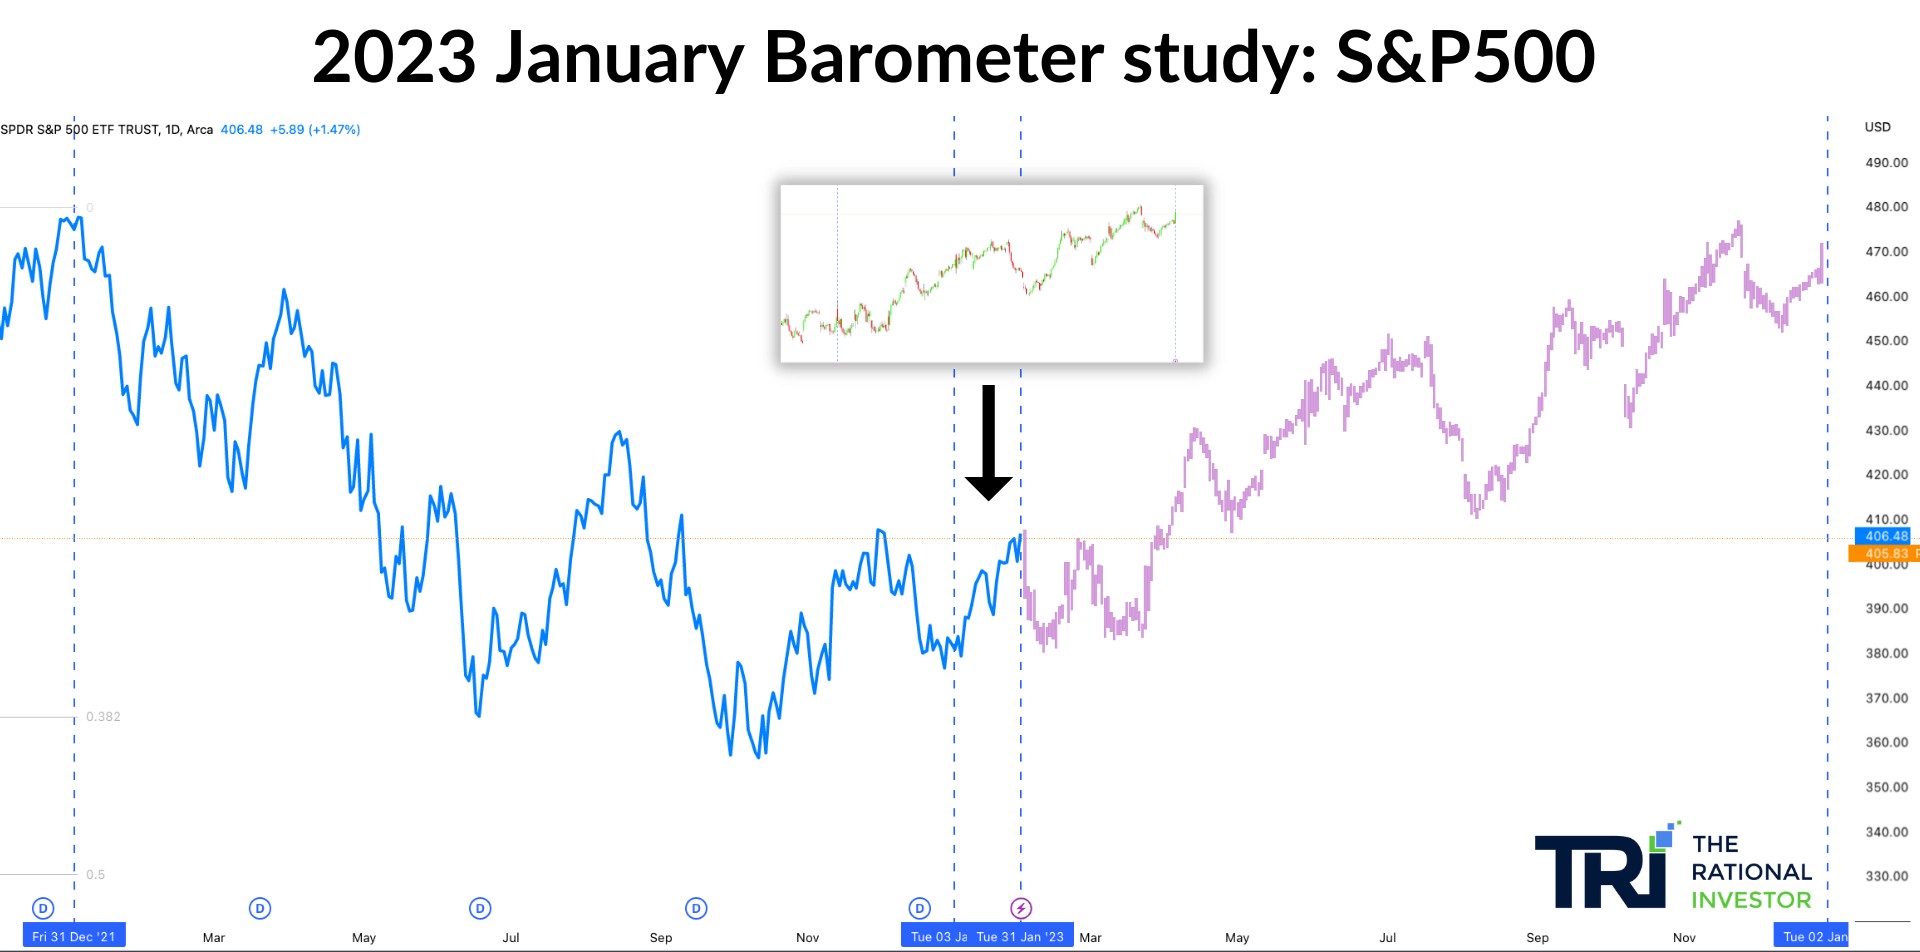
TRI’s 2023 January Barometer setup. The S&P 500 (SPY) showed a positive January, signaling a bullish year ahead. The dashed lines mark the January window.
What actually happened:
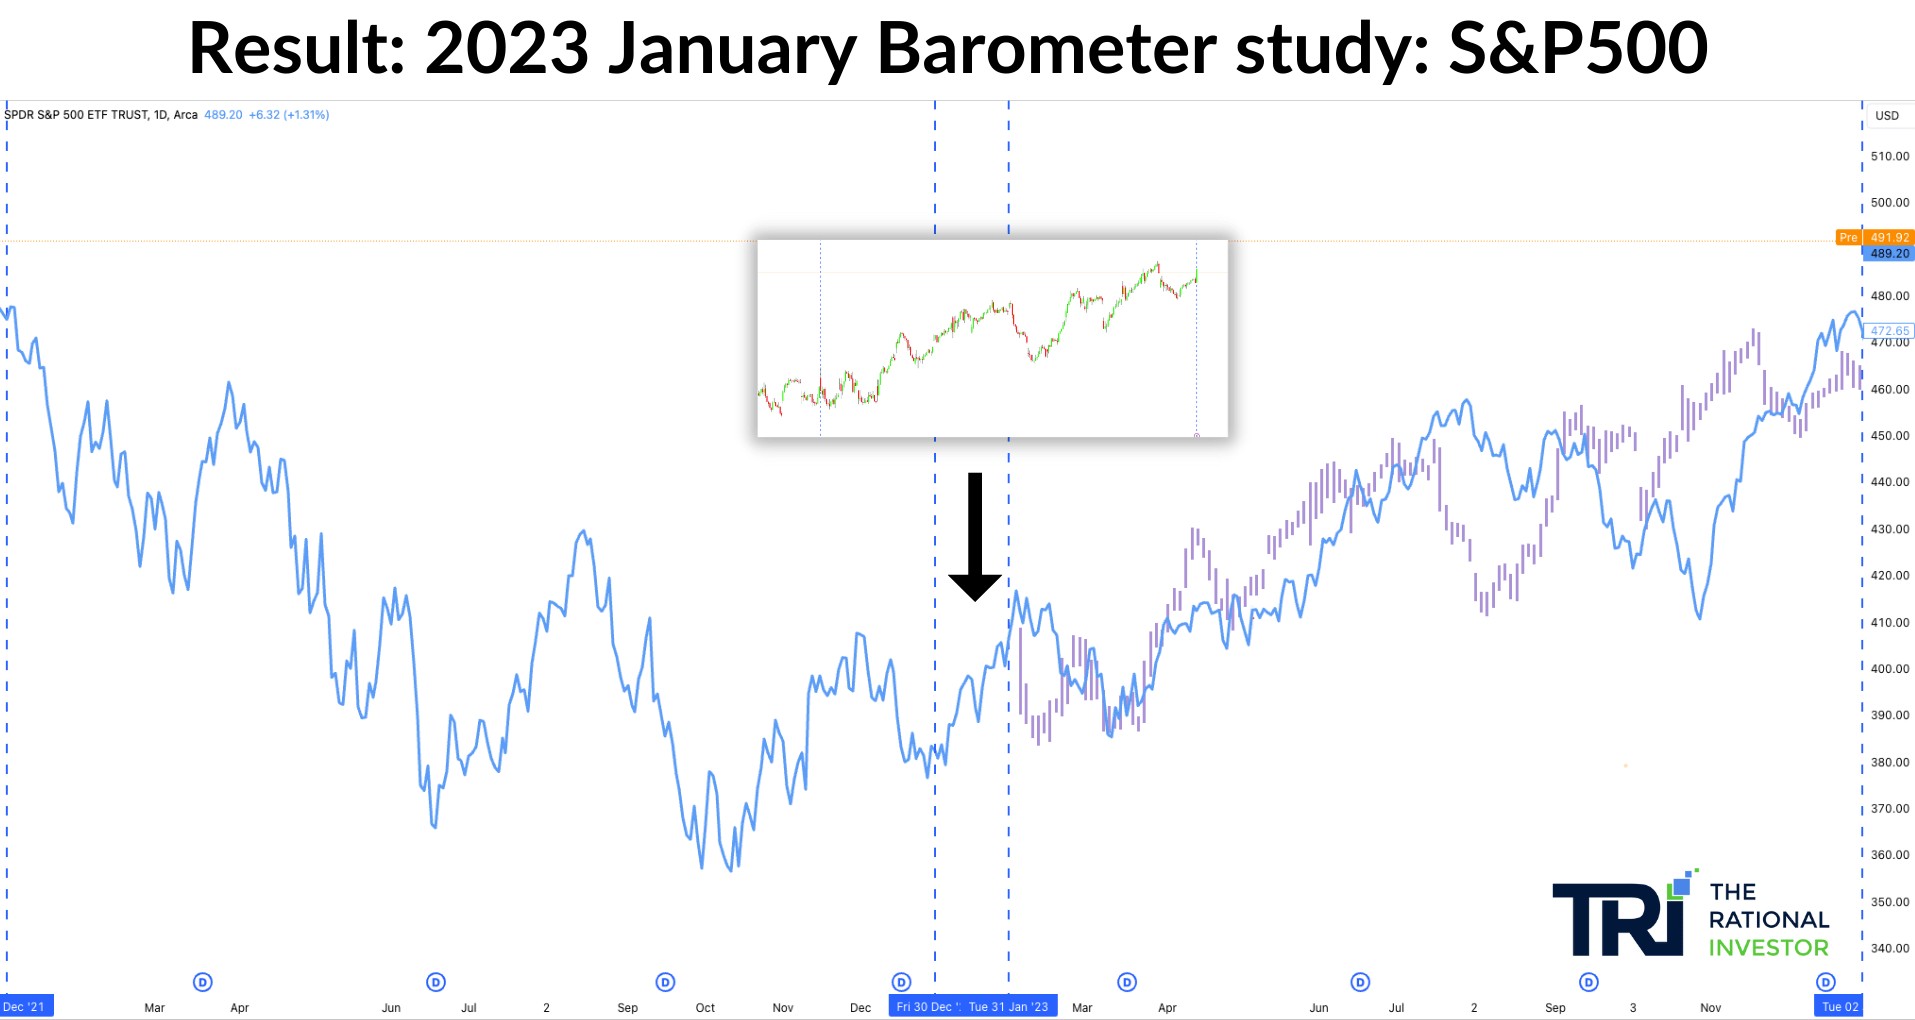
The result: after a bullish January 2023, the S&P 500 rallied roughly 24% for the full year. The barometer was accurate, though the path was not a straight line. There were pullbacks in February-March and August-October before the year-end rally.
The S&P 500 returned approximately 24% in 2023, confirming the bullish January signal. The barometer was correct for the second consecutive year.
Case Study: 2024 (Bullish January, Bullish Year + Election + BTC Halving)
2024 was unique: a presidential election year AND the Bitcoin halving year. January 2024 was modestly positive on the S&P 500.
The January Barometer prediction: Bullish, with the caveat that election years typically show weakness early and strength late.
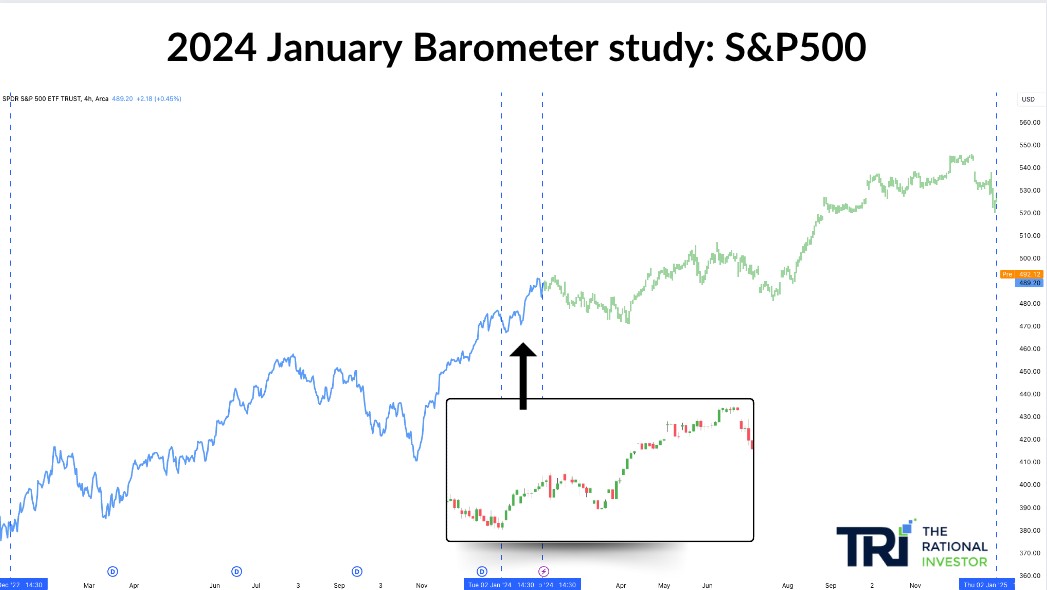
TRI’s 2024 January Barometer. The first half showed consolidation and a W-pattern base (consistent with election year seasonality), while the second half rallied strongly into and after the November election.
The Election Year Factor
2024 was the biggest election year in history, with nearly 3 billion people voting globally. Election years are historically volatile but tend to finish bullish. The market rallies on reduced uncertainty once results are known.
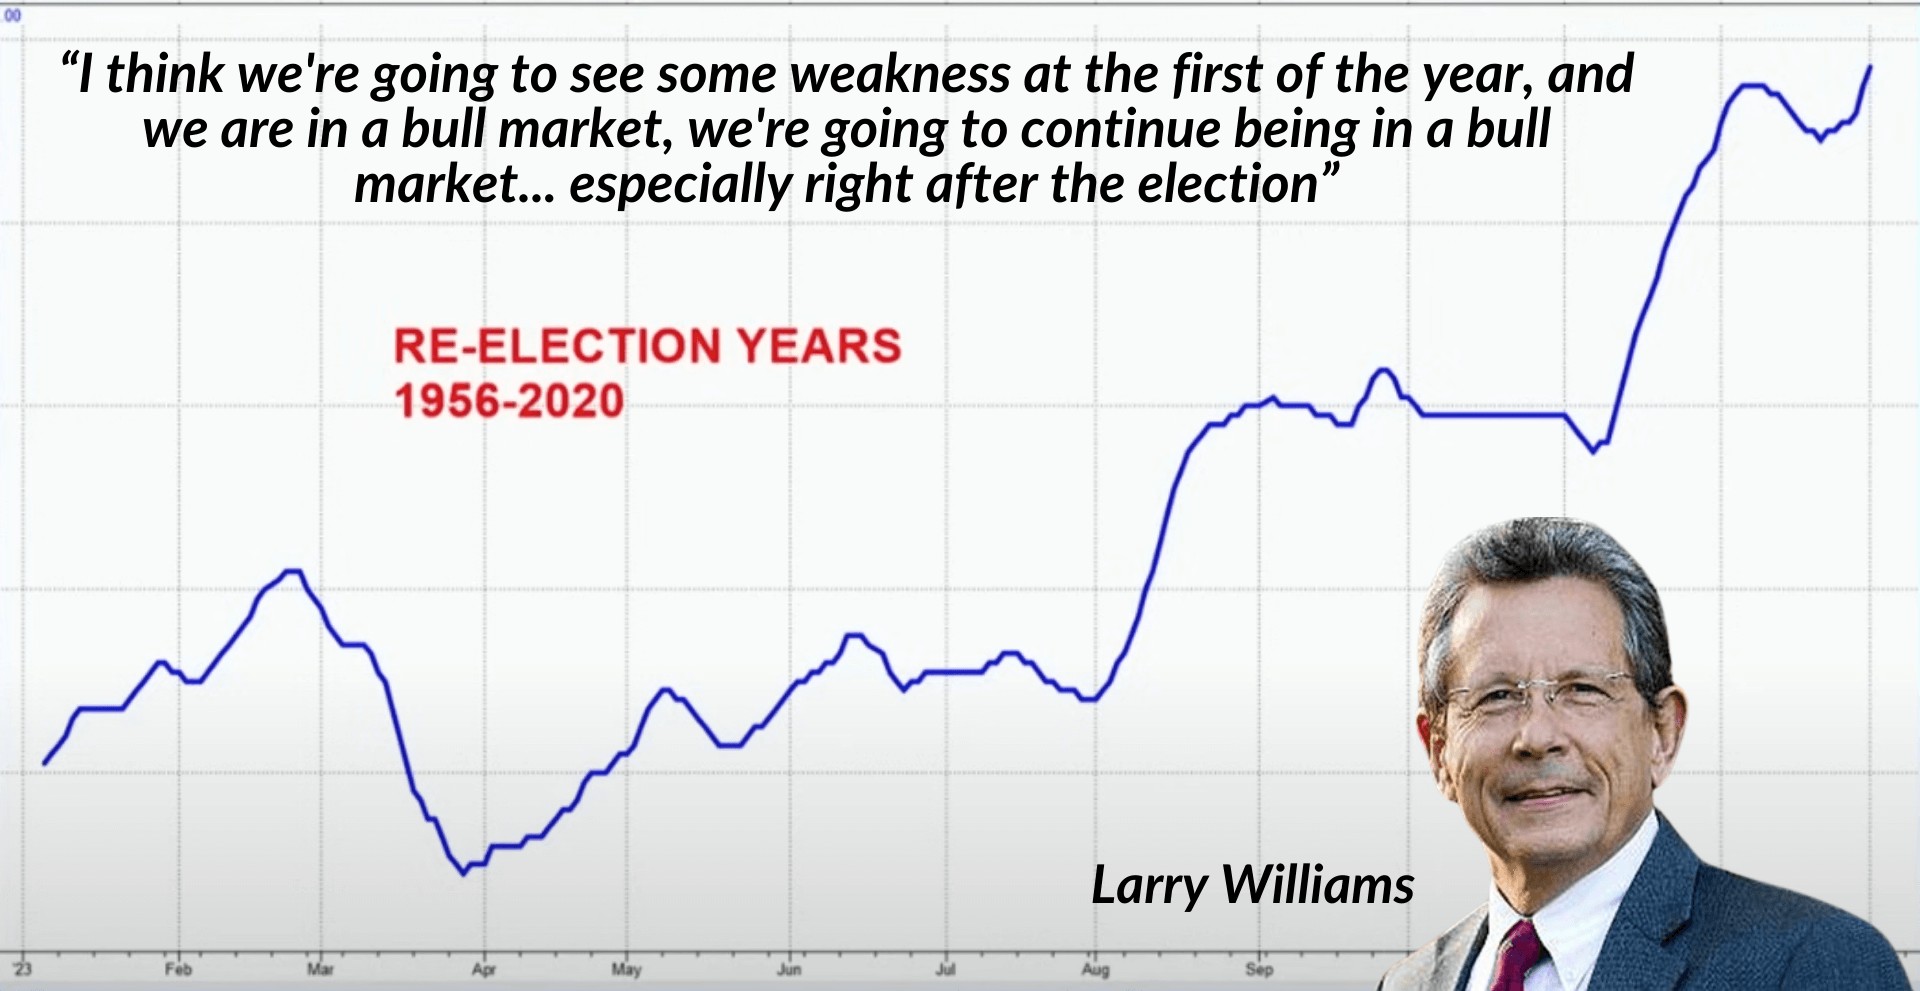
Larry Williams’ re-election year composite (1956-2020). Presidential election years typically show first-half weakness and consolidation, followed by a strong second-half rally. 2024 followed this pattern closely.
The stock market generally performs best under split government (neither party controls both Congress and the presidency), because legislative gridlock reduces the risk of sudden policy changes to taxes, regulations, and market rules.
The Bitcoin Halving Connection
The Bitcoin halving occurred in April 2024, adding another bullish catalyst to the year. Bitcoin topped around $73,000 before the halving, pulled back, then pushed to new all-time highs above $100,000 by year-end.
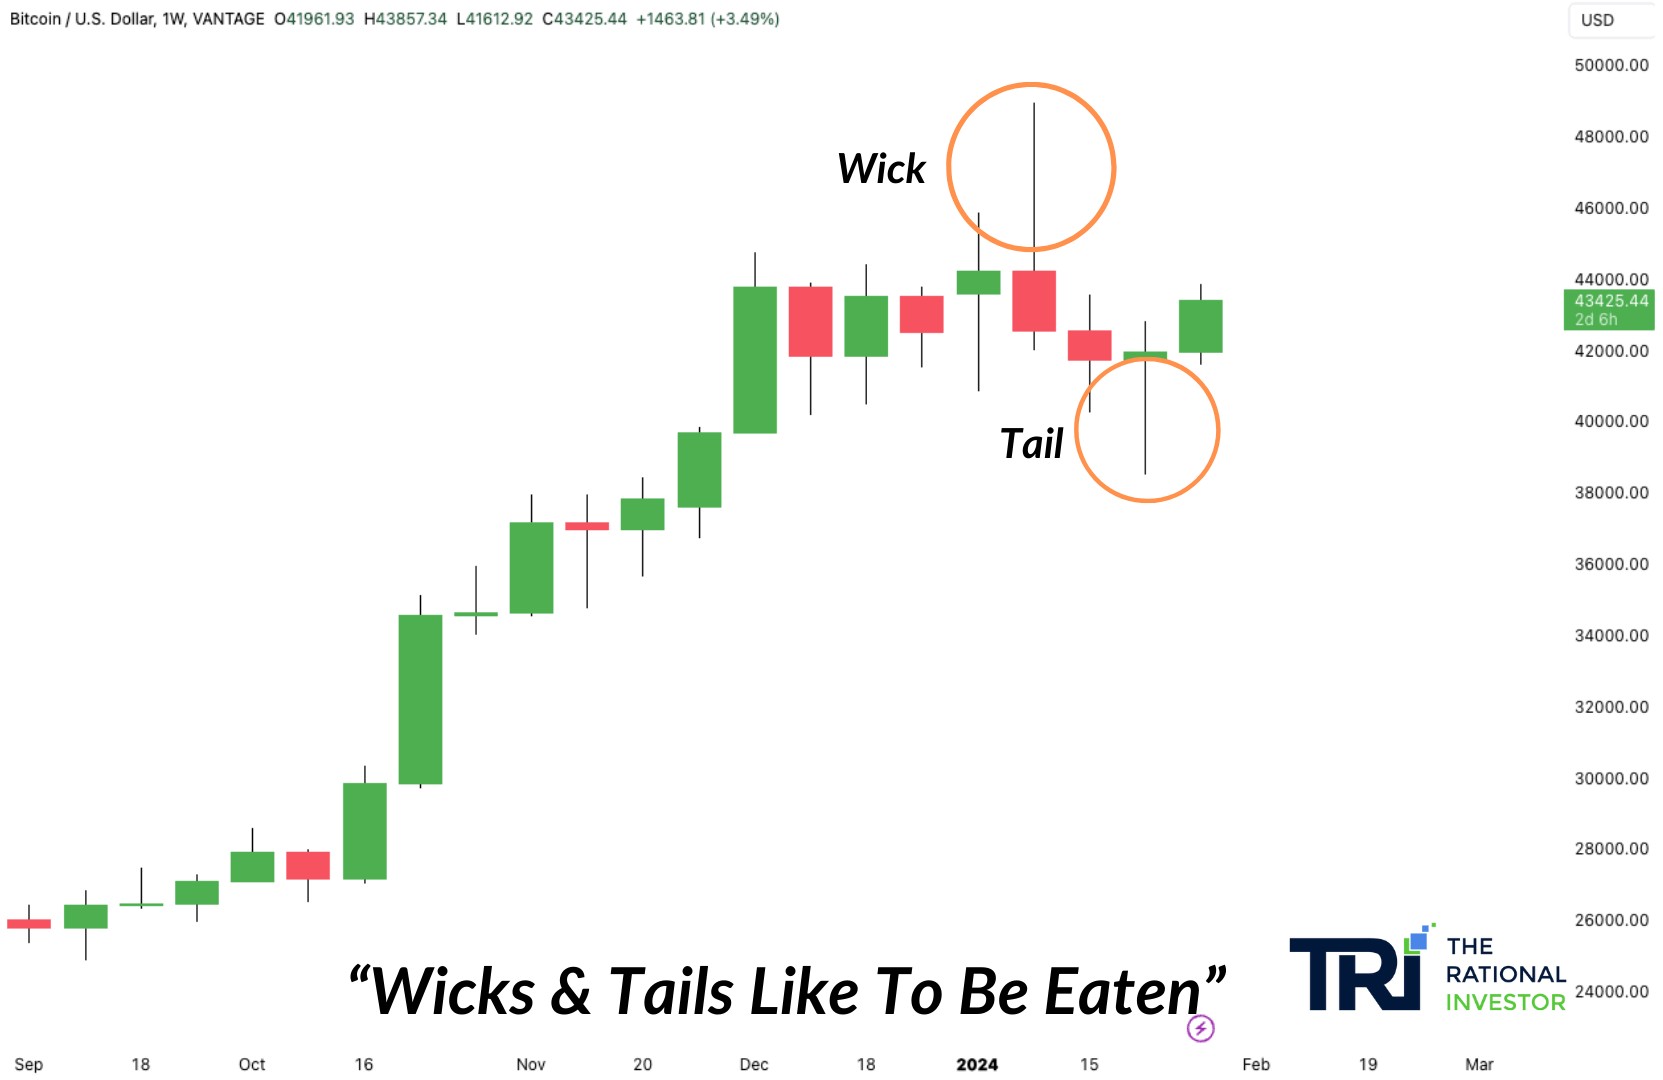
Bitcoin’s weekly chart heading into the 2024 halving. The large wicks and tails on the weekly candles indicated indecision and a potential distribution range before the next directional move. At TRI, we use the principle “wicks and tails like to be eaten” - price tends to revisit and fill these areas before committing to a direction.
What actually happened: The S&P 500 returned approximately 25% in 2024. Bitcoin hit ~$109,000 in January 2025. The January Barometer was correct for the third consecutive year.
Case Study: 2025 (Bullish January, Volatile but Bullish Year)
January 2025 was positive on the S&P 500, continuing the bullish momentum from 2024’s election rally.
What actually happened: The S&P 500 returned +17.9% for the full year 2025, making it the third consecutive year of double-digit gains. However, the path was anything but smooth. The market dropped nearly 19% during the spring of 2025 following aggressive tariff announcements, then surged roughly 39% from the April low through year-end as tariff rates were subsequently lowered. Over 75% of the full-year gain came from earnings growth rather than multiple expansion.
The January Barometer was correct for the fourth consecutive year, though the mid-year drawdown would have tested anyone relying solely on the January signal without a risk management plan.
Case Study: 2026 (Mildly Bullish January, Year in Progress)
January 2026 closed up approximately 1.3% on the S&P 500. A positive but modest signal.
The January Barometer prediction: Mildly bullish. When January is positive, the S&P 500 has historically averaged a full-year return of roughly 15-17%. However, this is one of the weaker positive signals, similar to 2024’s January.
What is happening so far: As of March 2026, the market has pulled back from its January highs. The year remains early and the barometer’s track record suggests patience. The Benner Cycle marks 2026 as a “sell year” (high prices, time to take profits), which creates a potential conflict with the mildly bullish January signal. When frameworks conflict, the prudent approach is to reduce position size and stay alert.
The Benner Cycle Connection
The January Barometer does not exist in isolation. It aligns with longer-term cycle frameworks, particularly the Benner Cycle, which marks specific years as periods of high prices (selling years) or low prices (buying years).
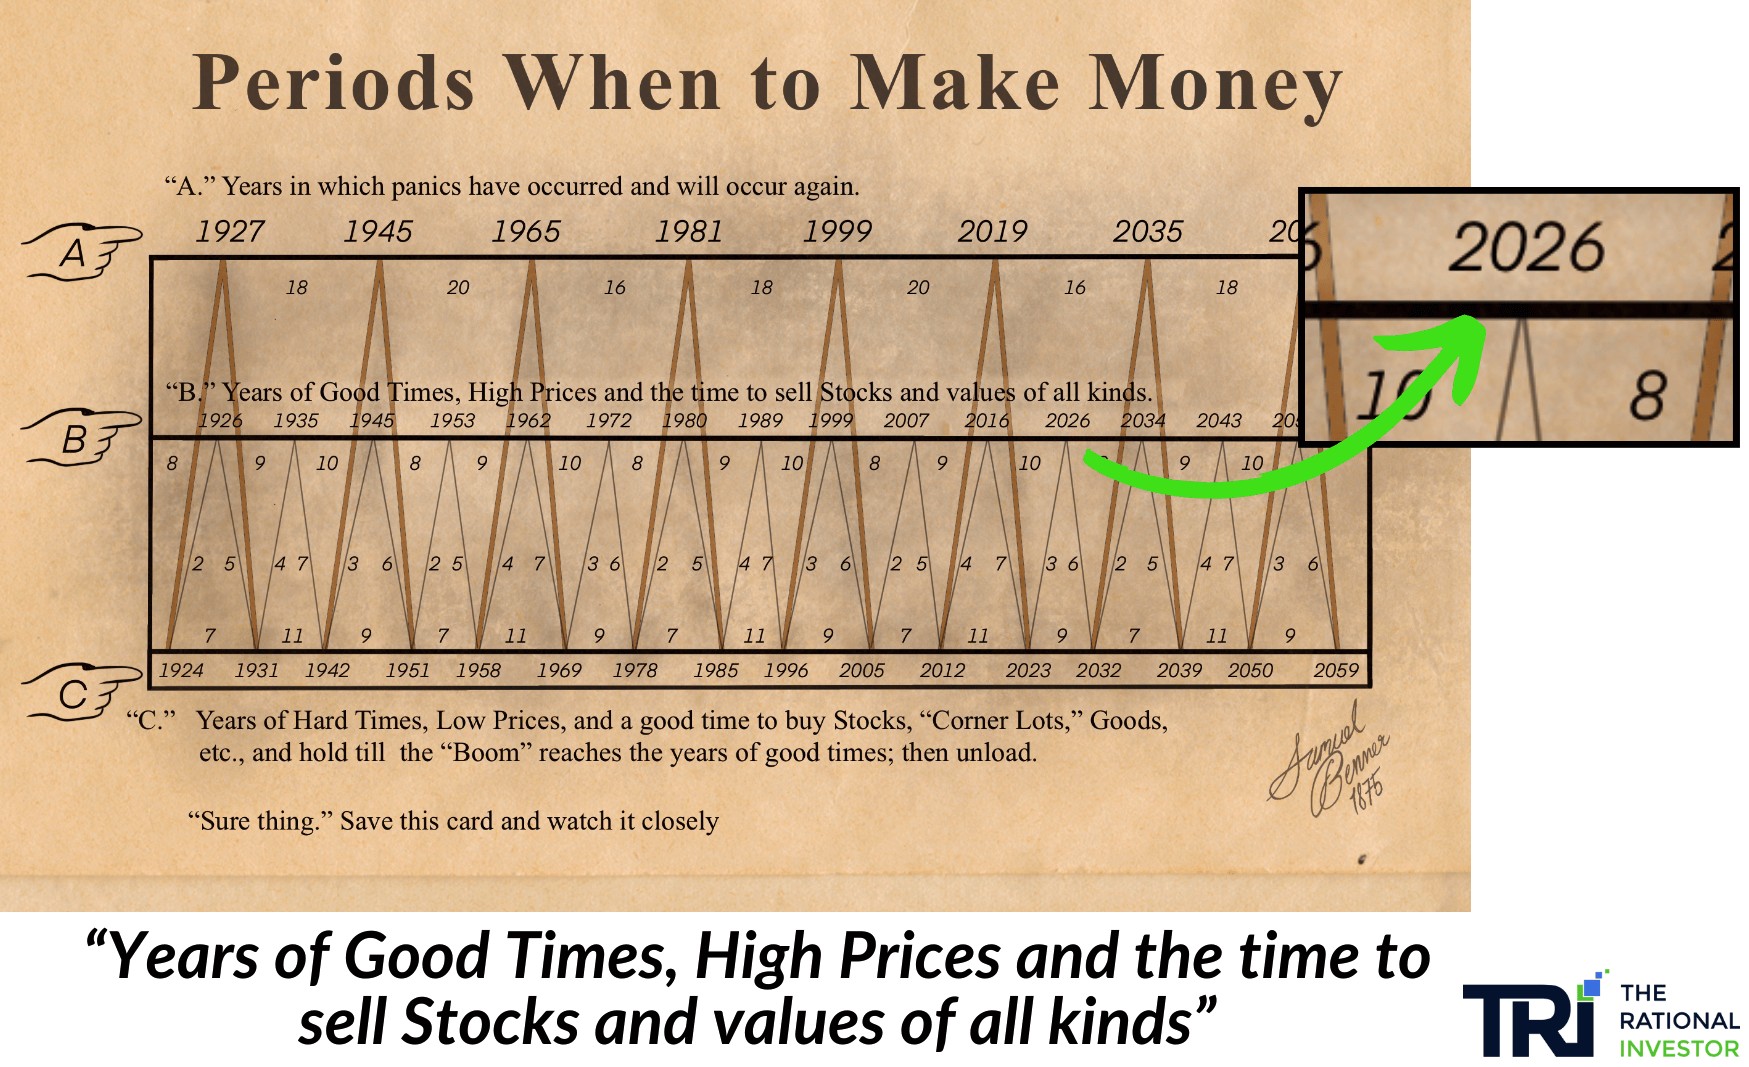
The Benner Cycle marks 2026 as a “sell year” - a period of high prices where it is historically optimal to take profits. This aligns with the Bitcoin 4-year cycle, which projects a potential peak in the 2025-2026 window. For a full breakdown, see our Benner Cycle guide.
The convergence of the January Barometer, election cycle, Benner Cycle, and Bitcoin halving cycle gives traders a multi-layered framework for positioning. No single indicator is reliable alone, but when multiple frameworks agree, the signal strengthens.
Industrial Production as a Confirmation Signal
One macro indicator that complements the January Barometer is the rate of change (ROC) in industrial production. When industrial production’s ROC peaks and turns down, it historically leads stock market weakness by 6-12 months.
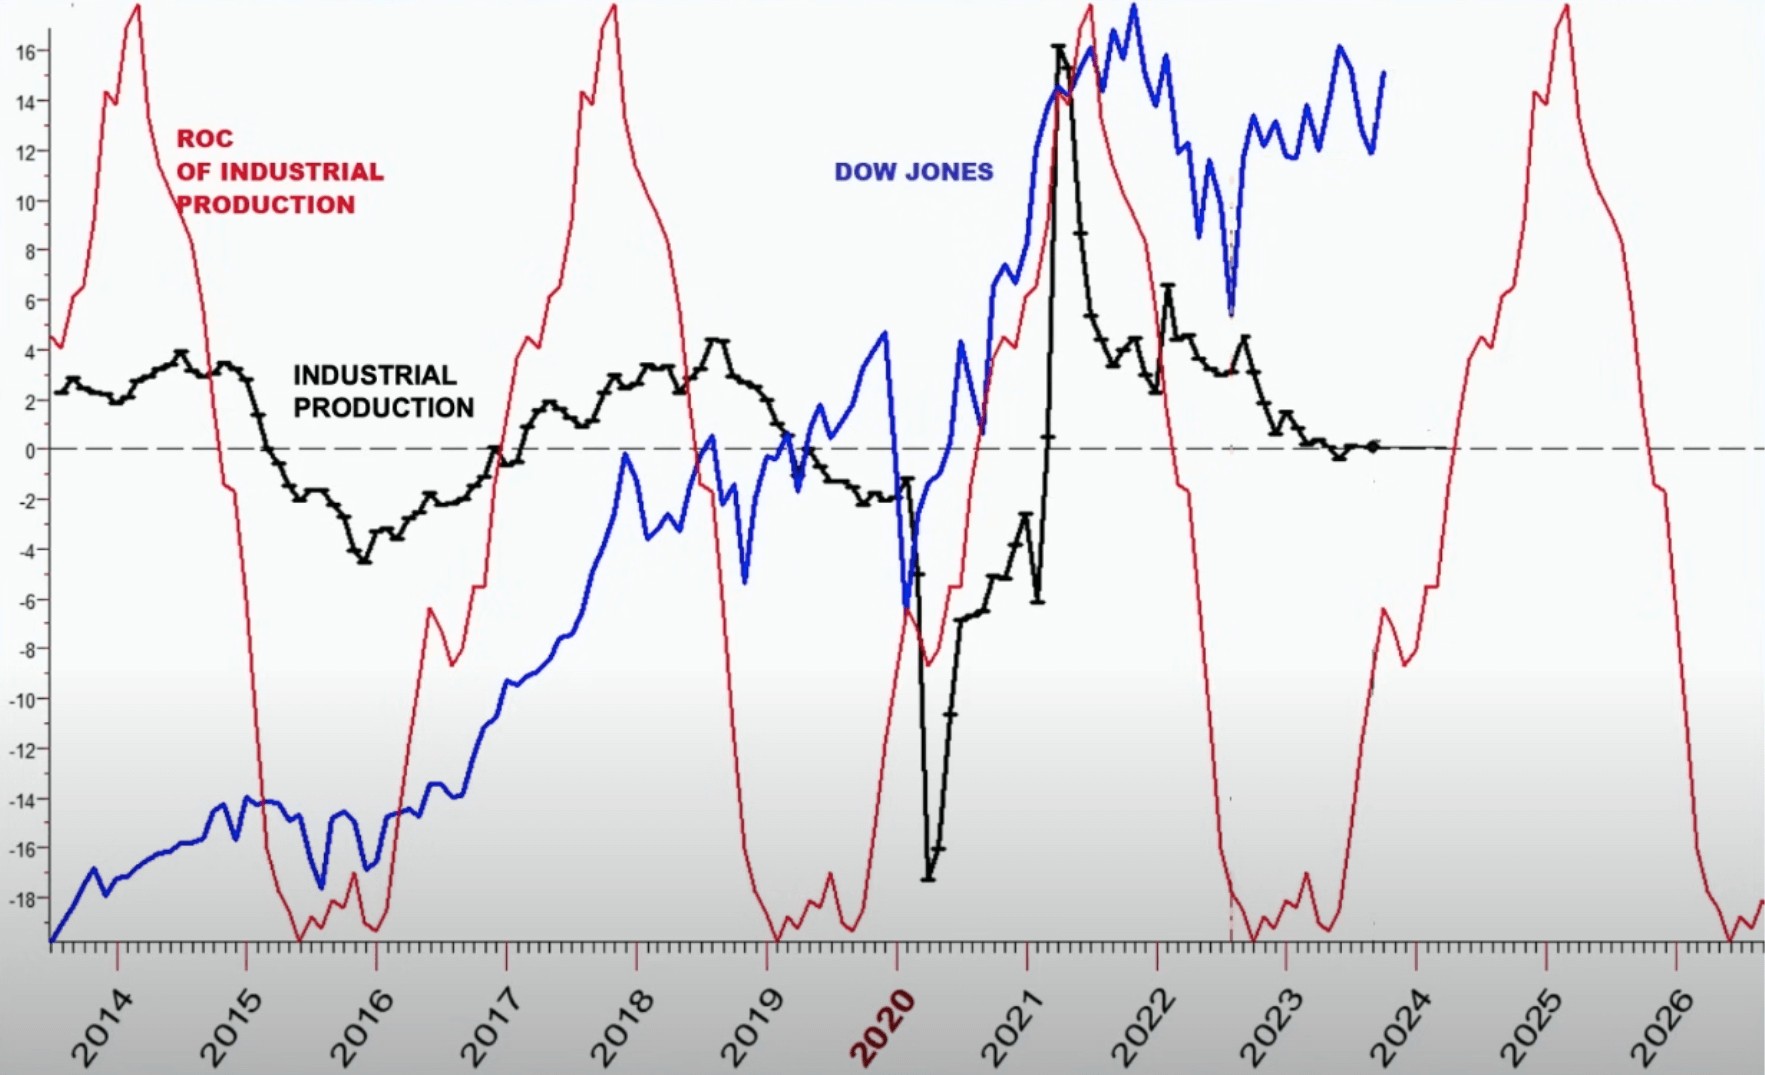
Industrial production ROC (red) vs. Dow Jones (blue) from 2014-2026. The ROC peaked in 2021 and has been declining, with a projected trough around 2025-2026. This pattern has correctly signaled major market transitions at the 2020 bottom and 2022 top.
How to Use the January Barometer
The January Barometer is a directional bias tool, not a trading signal. Here is how to apply it practically:
Step 1: Wait for January to close. Do not act on the first week or first day alone. The full-month signal has the highest accuracy.
Step 2: Determine the signal.
- January closes positive: lean bullish for the year. Favor long positions, buy dips.
- January closes negative: lean cautious. Reduce exposure, tighten stops, look for short setups.
- January closes flat (less than 1%): no clear signal. Use other indicators.
Step 3: Combine with other frameworks.
| Framework | What It Tells You | Where to Check |
|---|---|---|
| January Barometer | Full-year directional bias | S&P 500 January close vs. December close |
| Election cycle | 4-year seasonal pattern | Presidential year (bullish), midterm year (volatile) |
| Benner Cycle | Multi-decade sell/buy years | TRI Benner Cycle guide |
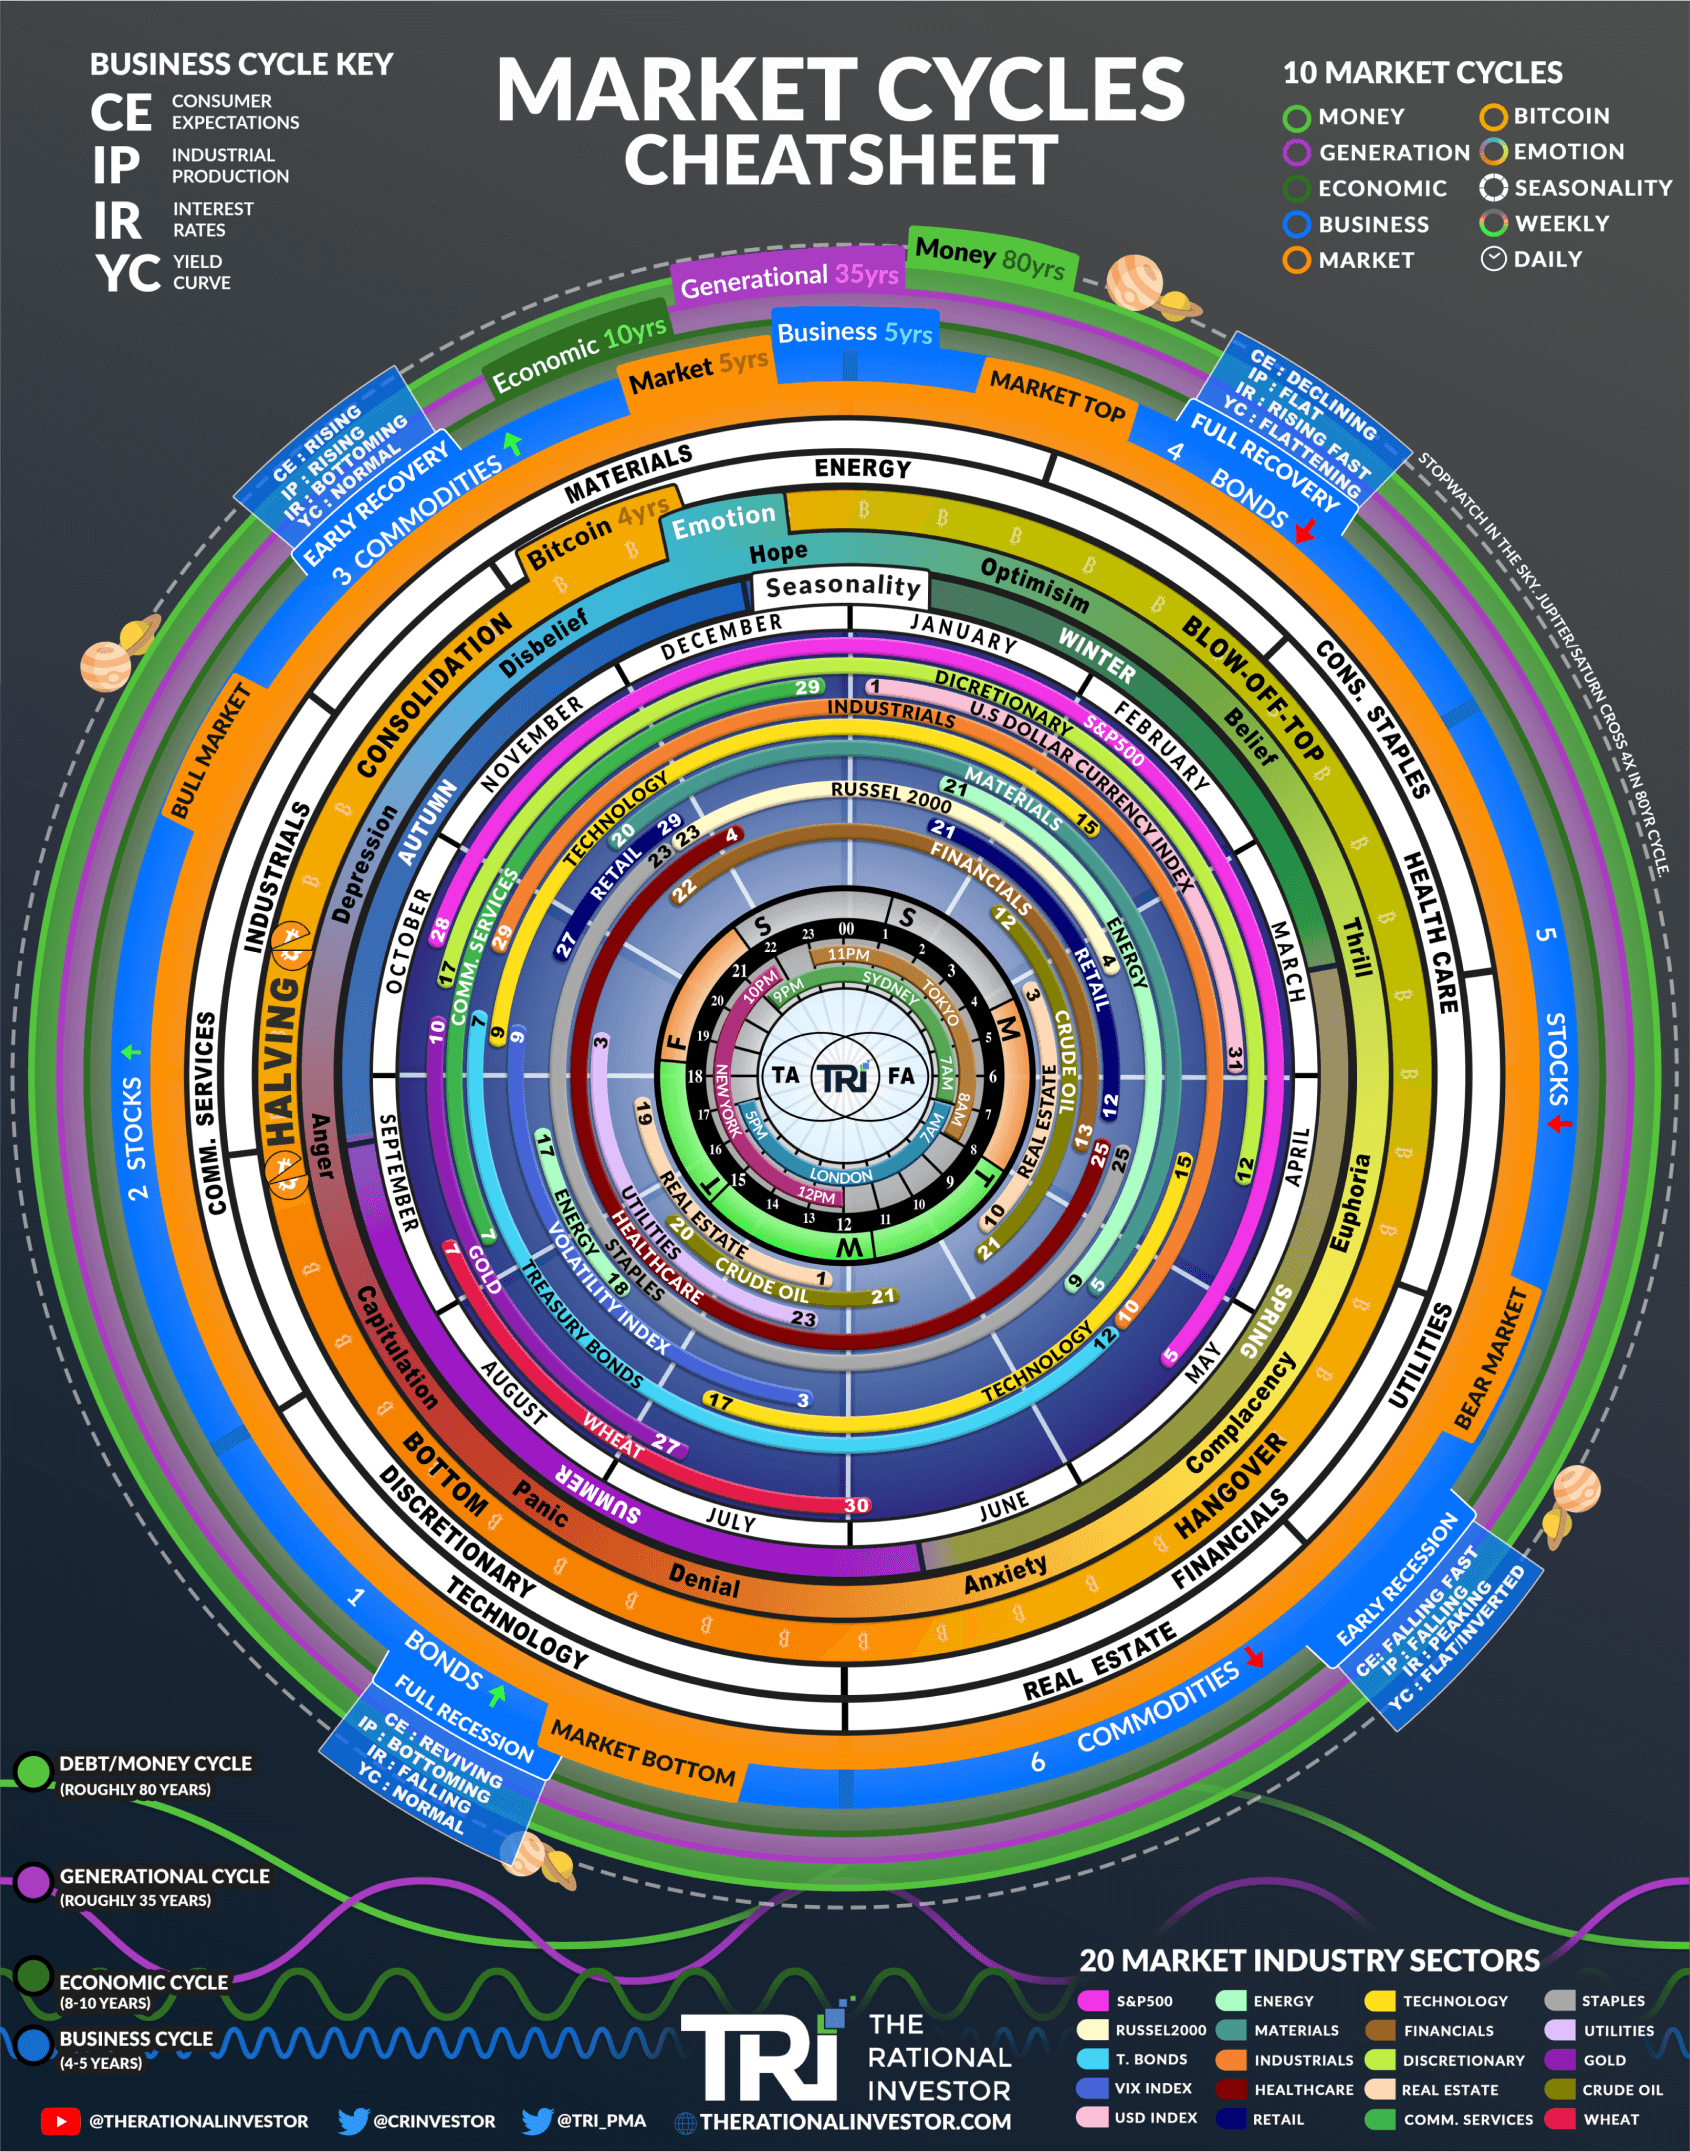
| Seasonality | ”Sell in May” and Q4 rally | TRI Market Cycles guide |
| Bitcoin halving | 4-year crypto cycle | TRI Bitcoin Halving guide |
Step 4: Adjust throughout the year. The January Barometer sets your starting bias. It does not mean you hold blindly. Use your trading plan, risk management rules, and market conditions to adjust as new data arrives.
Limitations and Criticisms
The January Barometer is not infallible. Important caveats:
-
General market upward bias. Critics argue that since the S&P 500 finishes positive roughly 75% of all years anyway, a 75% accuracy rate for a “bullish January = bullish year” prediction is not statistically impressive. The barometer is most useful when January is negative, because negative Januarys predict negative years at a higher rate than the base rate would suggest.
-
Small sample size for errors. Only about 12 significant errors since 1950. That is a strong track record, but 12 data points of failure is not enough to model the failure cases precisely.
-
Not a timing tool. The barometer tells you the likely direction for the year but says nothing about when the move happens. In 2022, January was bearish and the year was bearish, but the actual bottom did not arrive until October, ten months later.
-
Macro regime changes. The barometer was developed in an era before quantitative easing, algorithmic trading, and zero-day options. Whether the same institutional rebalancing dynamics drive January price action in the current market structure is debatable.
Bottom line: Use the January Barometer as one input among many. It is a directional filter, not a standalone strategy.
January Barometer Scorecard (2022-2026)
| Year | January Return | Barometer Signal | Full-Year S&P 500 | Correct? |
|---|---|---|---|---|
| 2022 | -5.3% | Bearish | -19.4% | Yes |
| 2023 | +6.2% | Bullish | +24.2% | Yes |
| 2024 | +1.6% | Mildly bullish | +25.0% | Yes |
| 2025 | Positive | Bullish | +17.9% | Yes |
| 2026 | +1.3% | Mildly bullish | In progress | TBD |
Four consecutive years correct. The barometer’s real-time track record at TRI matches its historical accuracy. The 2026 reading is mildly bullish but conflicts with the Benner Cycle’s “sell year” signal, making this year a key test of the framework.
Frequently Asked Questions
What is the January Barometer? The January Barometer is a stock market theory created by Yale Hirsch in 1972. It states that the S&P 500’s performance in January predicts the market’s direction for the rest of the year. Since 1938, this indicator has been approximately 75-80% accurate for the S&P 500 and Dow Jones.
How accurate is the January Barometer? The S&P 500 January Barometer has a 75.9% accuracy rate for predicting the calendar year direction. The Dow Jones version is slightly higher at 79.7%. The Nasdaq version is lower at 67.4%. These numbers come from the Stock Trader’s Almanac dataset going back to 1938.
Does the January Barometer work for Bitcoin? Bitcoin does not have enough data to test the January Barometer rigorously (only ~15 years of history). However, Bitcoin’s 4-year halving cycle is a stronger and more mechanistically grounded predictor for crypto than any single-month indicator. For Bitcoin cycle analysis, see our halving cycle guide.
What happens in election years? Presidential election years tend to be bullish overall, with weakness in the first half and strength in the second half (especially after November). Midterm election years (2 years into a presidency) are historically more volatile, with bottoms typically forming in the September-October window before a year-end rally.
Should I trade based on the January Barometer alone? No. The January Barometer is a directional filter, not a trading strategy. Use it to set your annual bias (bullish or cautious), then combine it with your trading plan, risk management rules, and other cycle frameworks (election cycle, Benner Cycle, seasonality) for actual trade decisions.
What is the January Effect vs. the January Barometer? They are different concepts. The January Effect refers to the tendency of small-cap stocks to outperform in January (driven by tax-loss selling reversal). The January Barometer is about whether the S&P 500’s full January performance predicts the rest of the year. The January Effect is about which stocks outperform; the January Barometer is about market direction.