10 Market Cycles Every Trader Should Know (With Charts)
Market cycles are repeating patterns in price and economic activity ranging from the daily trading session to the 80-year debt supercycle. Understanding these 10 key cycles helps traders identify where they are in the market and position accordingly.
What Are Market Cycles?
Market cycles are repeating patterns in price, sentiment, and economic activity that occur across different timeframes. Some repeat every 24 hours (the daily trading session cycle). Others take 80 years to complete (the long-term debt cycle). Understanding where you are in each cycle helps you make better decisions about when to buy, when to sell, and when to sit on your hands.
Markets are not random. They move in waves driven by human behavior, credit expansion and contraction, seasonal capital flows, and structural events like Bitcoin halvings or Federal Reserve policy shifts. These waves are measurable, and they repeat.
This guide breaks down 10 distinct market cycles, from the shortest (daily) to the longest (80-year debt supercycle), explains how each one works, and shows how they all nest together into one framework.
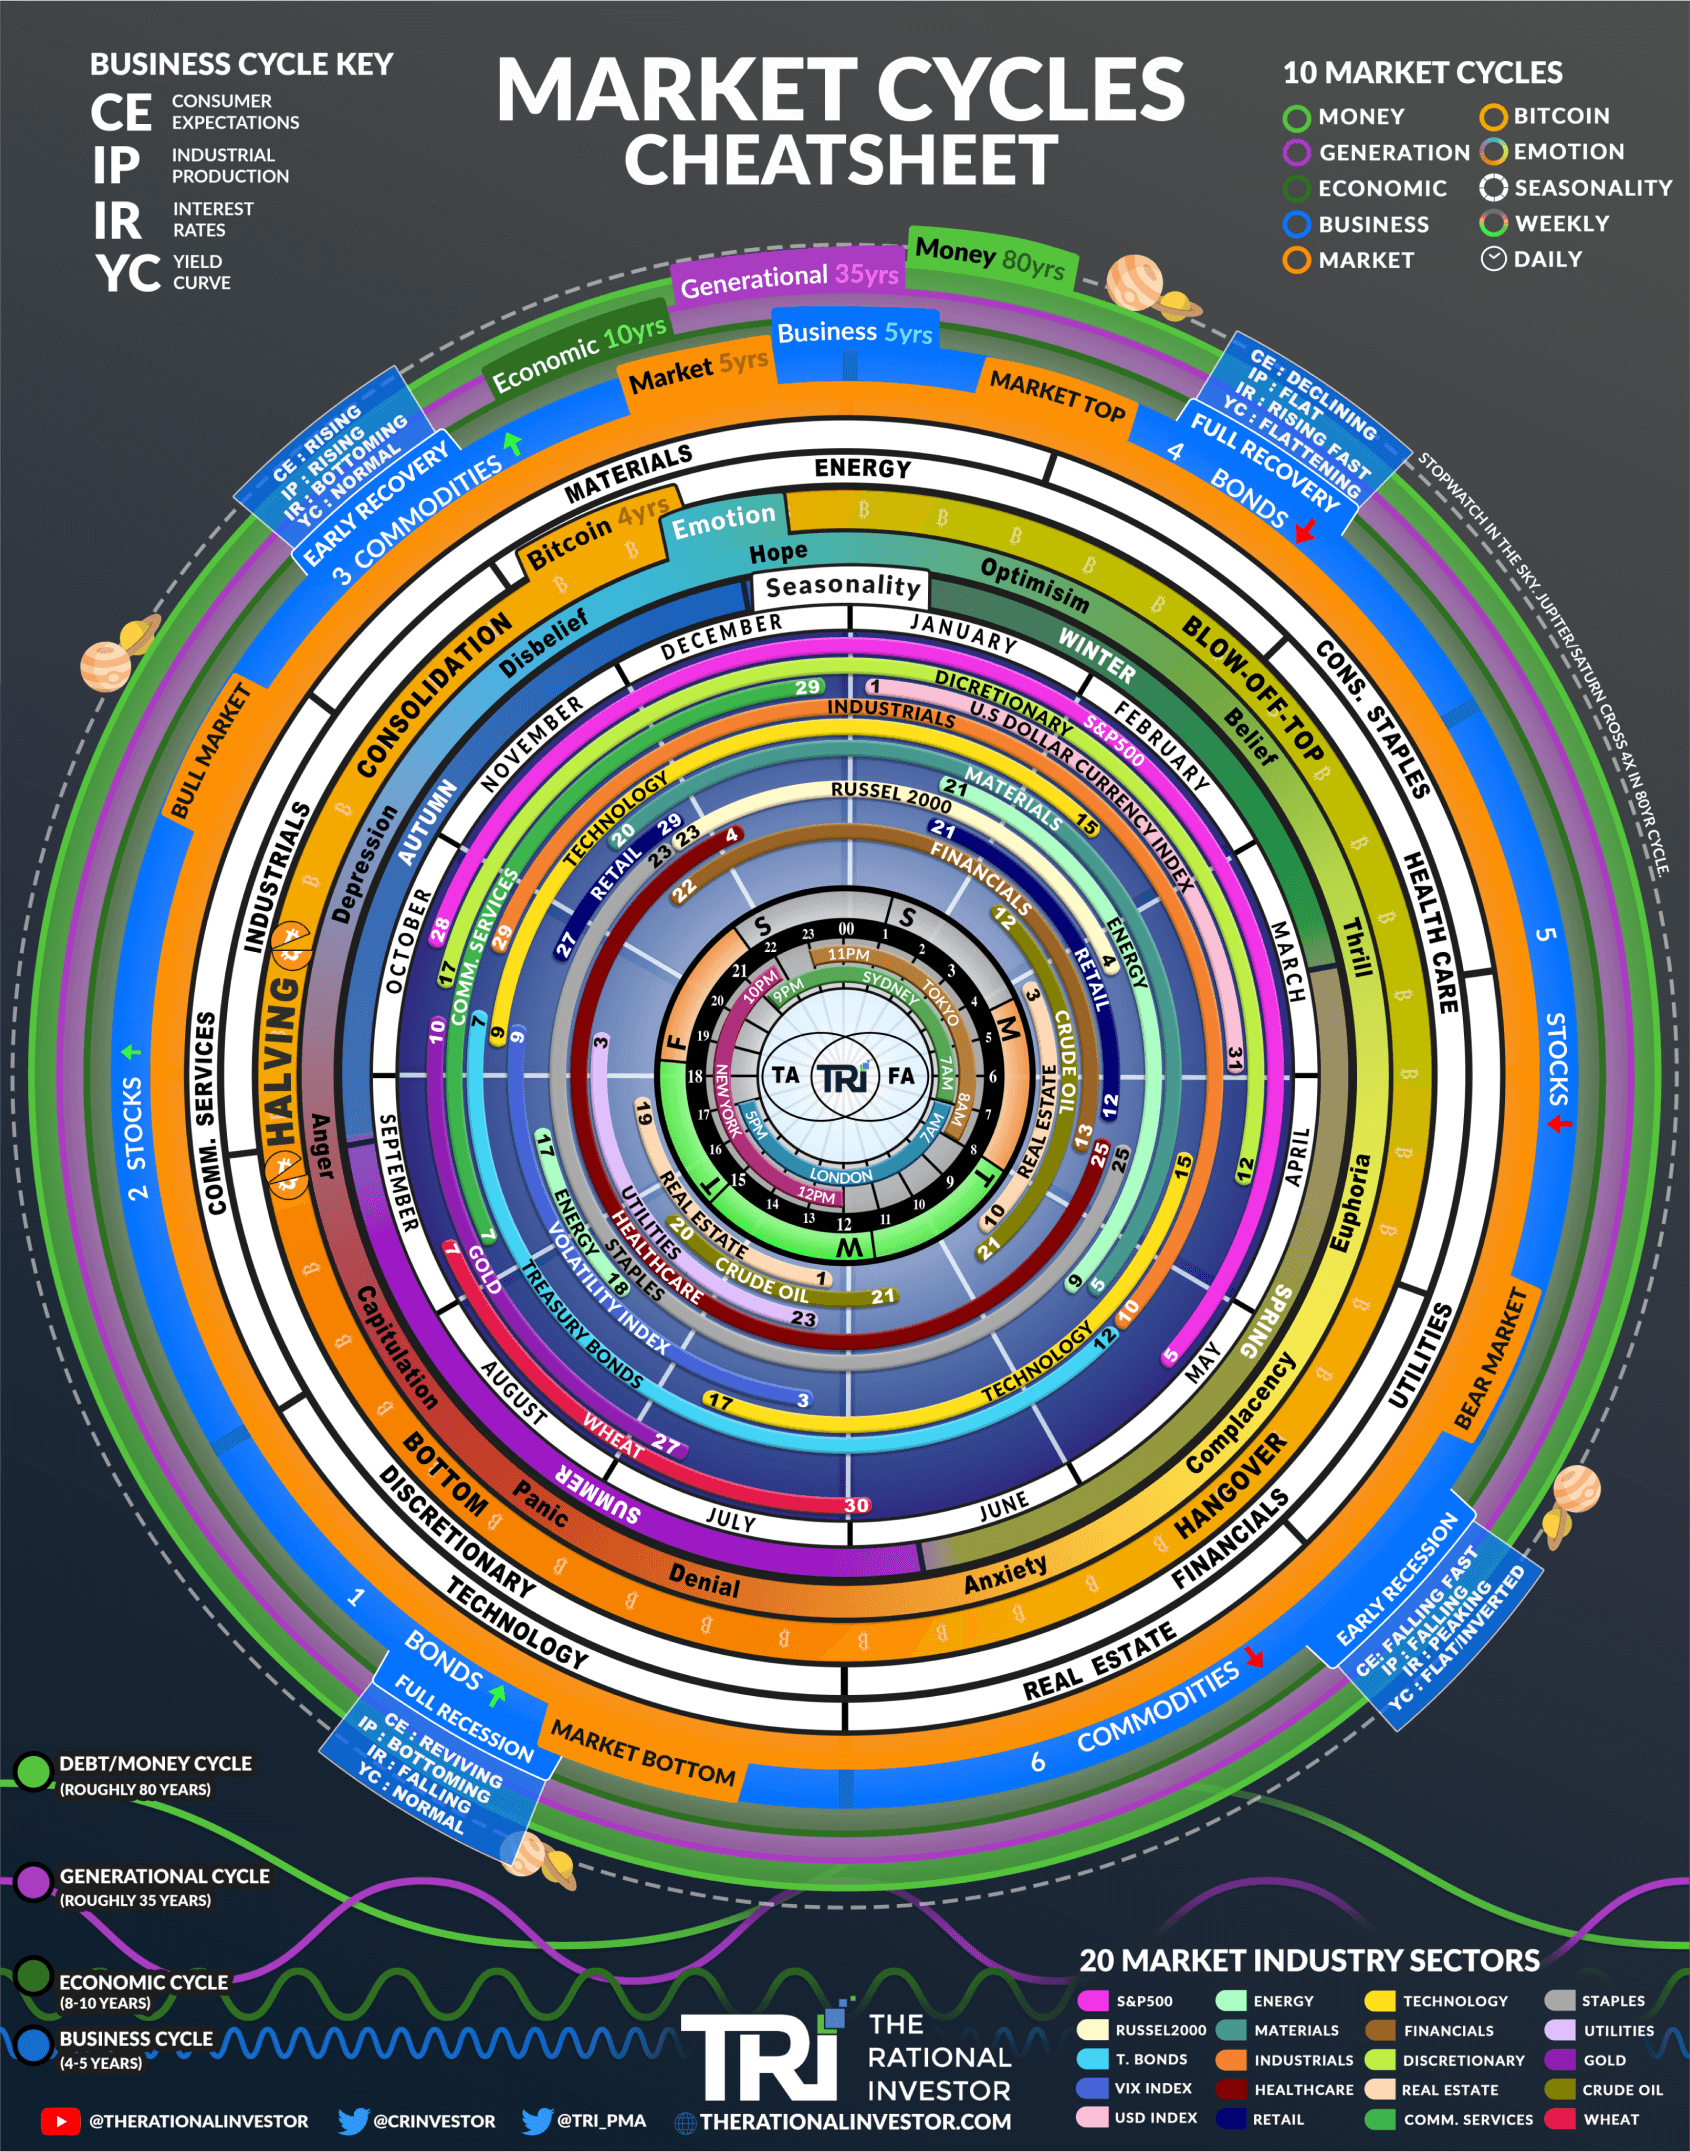
The TRI Market Cycles Cheatsheet. Each ring represents a different cycle timeframe, from the innermost daily cycle to the outermost 80-year money cycle. The 20 colored markers show where different sectors and asset classes tend to perform best within the business and economic cycles.
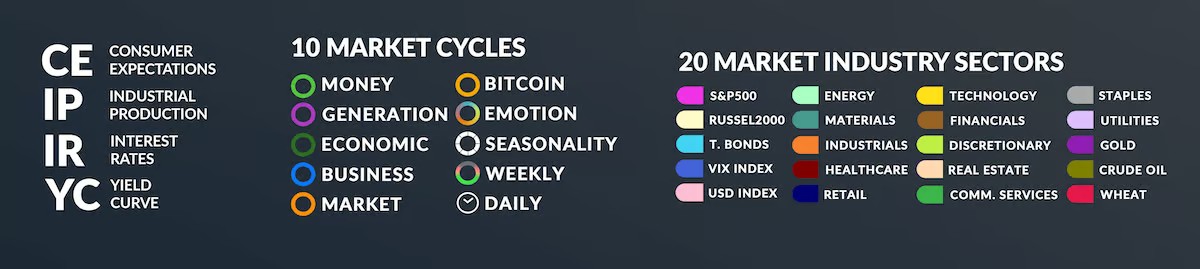
Key: The 10 cycles tracked in the infographic and the 20 market sectors used for rotation timing.
Why Cycles Matter for Trading
Most traders focus on a single timeframe. They look at a daily chart, find a pattern, and trade it. But that pattern exists inside a weekly trend, which exists inside a seasonal window, which exists inside a business cycle phase. Ignoring the bigger cycles is like checking the weather forecast without knowing what season it is.
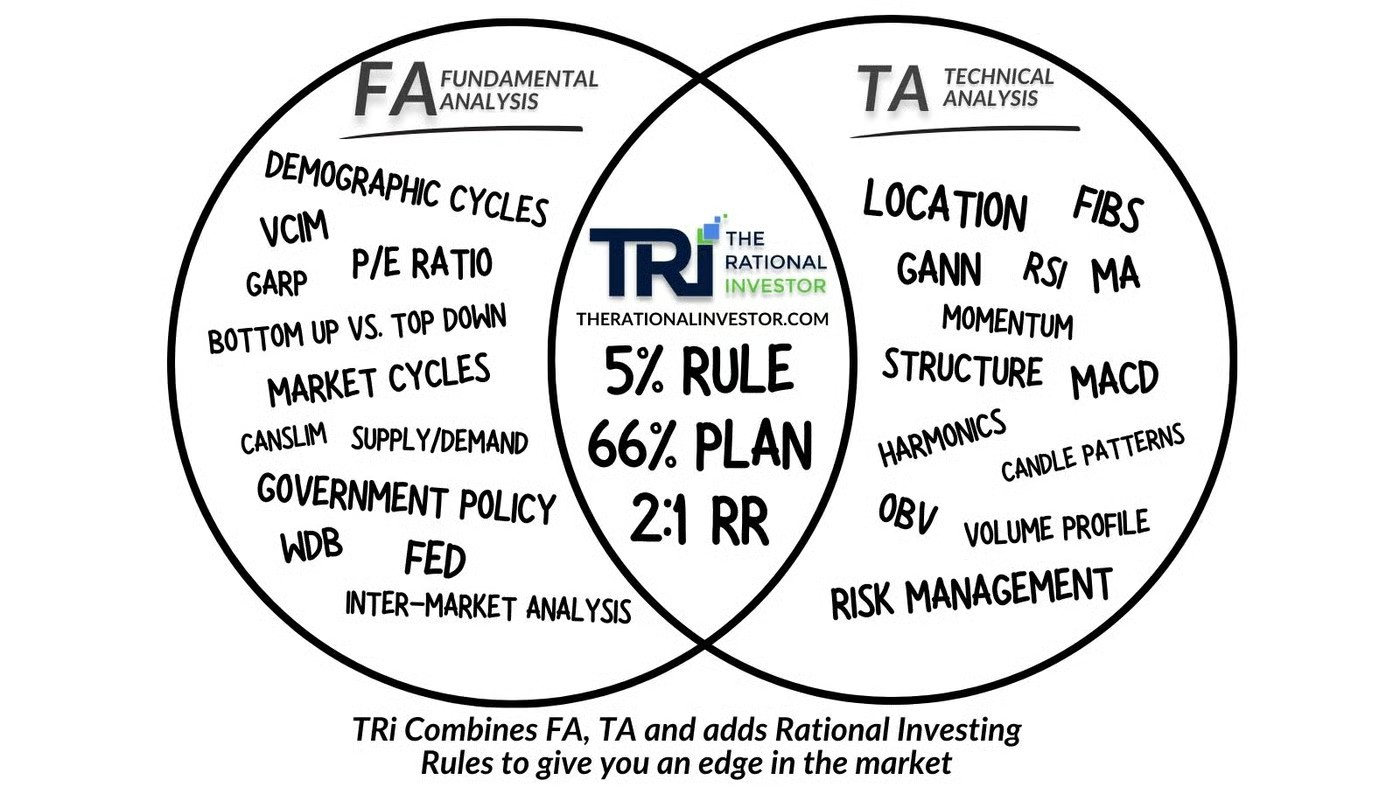
TRI combines fundamental analysis (macro cycles, economic data, valuations) with technical analysis (price structure, indicators, volume) and adds systematic rules for risk management.
When multiple cycles align in the same direction, the probability of a move increases significantly. When they conflict, the market tends to chop sideways or produce false signals. The goal is not to predict exact prices but to understand the environment you are trading in.
Cycle 1: The Daily Cycle (Kill Zones)
Timeframe: 24 hours. Repeats every trading day.
The daily cycle is driven by institutional trading sessions. The global forex and futures markets operate 24 hours, but liquidity is not evenly distributed. It concentrates around specific windows called “kill zones” where the major financial centers overlap.
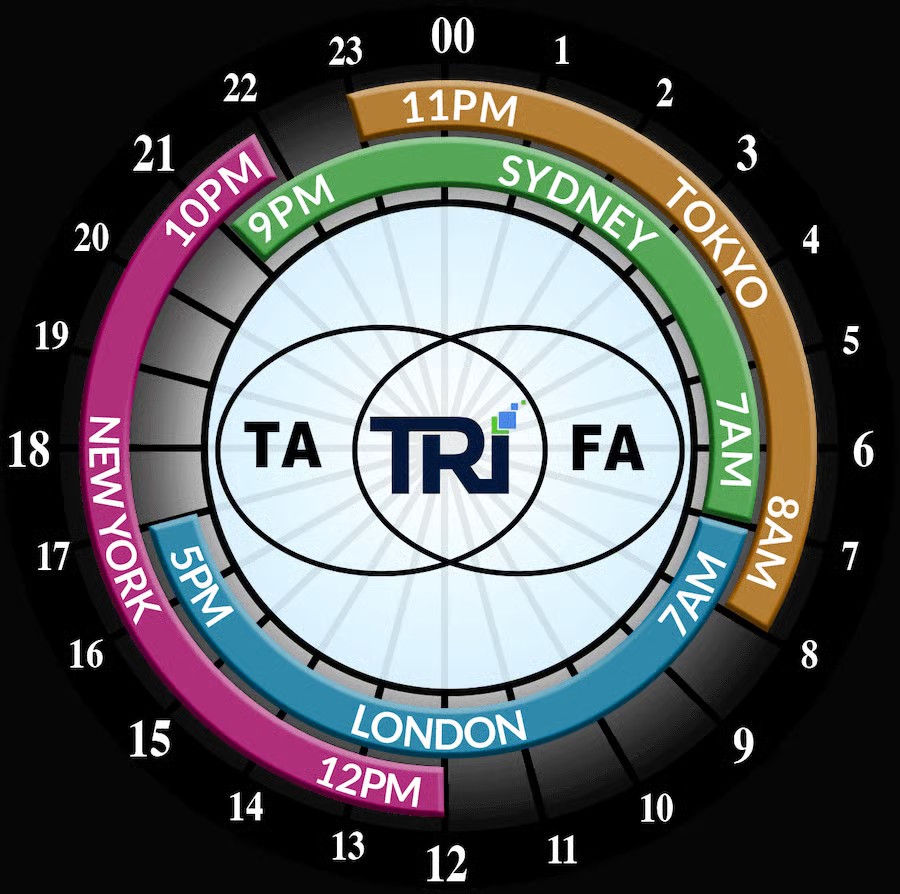
The four major trading sessions and their overlap windows. The London-New York overlap (roughly 12:00-17:00 UTC) produces the highest volume and largest moves of the day.
| Session | UTC Hours | Characteristics |
|---|---|---|
| Sydney | 21:00 - 06:00 | Low volume, range-bound, sets the Asian range |
| Tokyo | 00:00 - 09:00 | Moderate volume, trends within the Asian range |
| London | 07:00 - 16:00 | High volume, often breaks the Asian range, sets the daily direction |
| New York | 12:00 - 21:00 | Highest volume during London overlap, often reverses or extends the London move |
How to use it: The London open (07:00-09:00 UTC) and New York open (12:00-14:00 UTC) are when most of the day’s movement occurs. If you day trade, focus your energy on these windows. If you swing trade, place your orders outside kill zones to avoid getting stopped out by intraday volatility.
Cycle 2: The Weekly Cycle
Timeframe: 5 trading days. Repeats every week.
Markets have a measurable weekly rhythm. Mondays tend to open with a gap (up or down) that reflects weekend news and positioning. Fridays often see reduced volume as traders close positions before the weekend.
| Day | Typical Behavior |
|---|---|
| Monday | Gap open, often sets the weekly direction. Highest opening volatility. |
| Tuesday | Trend continuation from Monday. Often the strongest trend day. |
| Wednesday | Mid-week reversal or consolidation. Fed announcements often fall here. |
| Thursday | Position adjustment. Weekly options expiration effects begin. |
| Friday | Profit-taking, reduced volume. Weekly candle close determines the swing signal. |
How to use it: If you swing trade, the weekly close (Friday 4:00 PM ET) is your primary signal. A stock that closes the week above a key level is stronger than one that briefly touched it on Tuesday. Use the weekly candle for trend direction and the daily candle for entries.
Cycle 3: Seasonality
Timeframe: 12 months. Repeats every calendar year.
Certain months and periods consistently produce above-average or below-average returns. This is not random. It is driven by tax-loss harvesting, mutual fund rebalancing, bonus allocations, and fiscal year-end flows.
Key seasonal patterns:
| Pattern | Period | What Happens |
|---|---|---|
| January Effect | January | Small caps outperform as tax-loss selling reverses |
| Sell in May | May - October | Historically weaker 6-month period for equities |
| Summer doldrums | June - August | Lower volume, choppy price action |
| Q4 rally | October - December | Strongest quarter historically. Year-end window dressing. |
| Santa Claus Rally | Last 5 days of Dec + first 2 of Jan | Short burst of buying, often marks the tone for January |
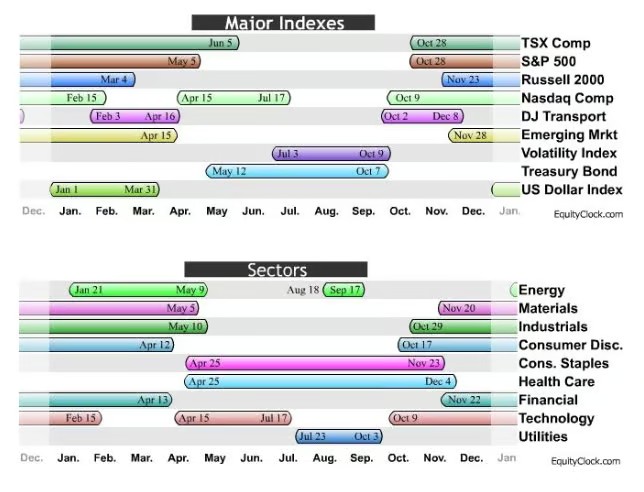
Seasonal strength windows for major indexes and sectors. Each bar shows the historically favorable period. Source: EquityClock.com
The S&P 500 has returned an average of roughly +7% during November through April versus roughly +2% during May through October over the past 50 years. This does not mean you sell everything in May, but it means the odds tilt in your favor during the winter months.
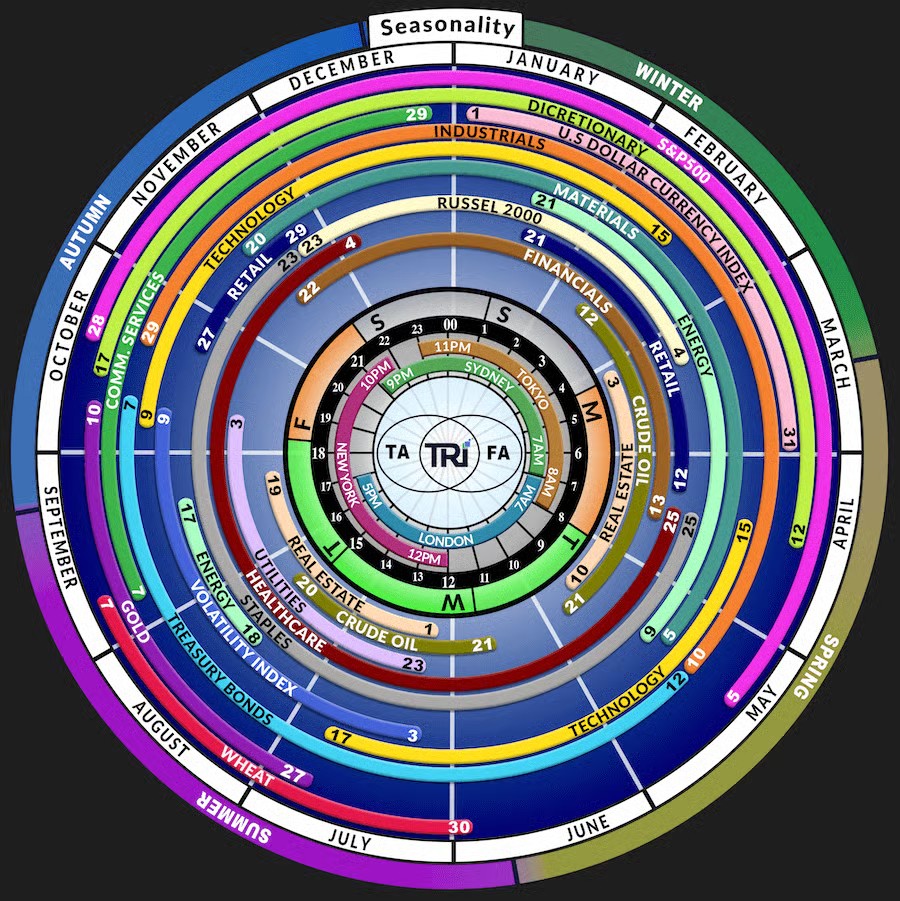
TRI’s layered view showing how sector seasonality, index seasonality, and trading session timing all operate simultaneously. The outer ring shows monthly sector rotation; the inner rings show weekly and daily patterns.
How to use it: Combine seasonality with other cycles. A bullish sector rotation setup that also lines up with a favorable seasonal window has higher conviction than either signal alone.
Cycle 4: The Market Cycle (4-5 Years)
Timeframe: 4-5 years on average. Driven by credit and sentiment.
The market cycle is the one most traders intuitively understand. It has four phases: accumulation (bottom), markup (bull market), distribution (top), and markdown (bear market). A full cycle from bottom to bottom typically takes 4-5 years.
| Phase | Duration | Characteristics | Smart Money Is… |
|---|---|---|---|
| Accumulation | 6-12 months | Low volume, flat prices, negative sentiment, media ignores the market | Buying |
| Markup | 1-3 years | Rising prices, increasing volume, improving sentiment, media turns positive | Holding, adding on dips |
| Distribution | 3-6 months | High volume, volatile prices, euphoric sentiment, media frenzy | Selling |
| Markdown | 6-18 months | Declining prices, panic selling, negative sentiment, media doomsday | Waiting, building watch lists |
Since 2000, major S&P 500 cycle bottoms: March 2003, March 2009, March 2020, October 2022. The average spacing is roughly 7 years, though the 2020 bottom was accelerated by COVID and the recovery was compressed by massive fiscal stimulus.
Cycle 5: The Business Cycle (4-5 Years)
Timeframe: 4-5 years. Driven by economic expansion and contraction.
The business cycle tracks GDP growth, employment, industrial production, and corporate earnings. It has six stages, and different asset classes outperform during each stage.
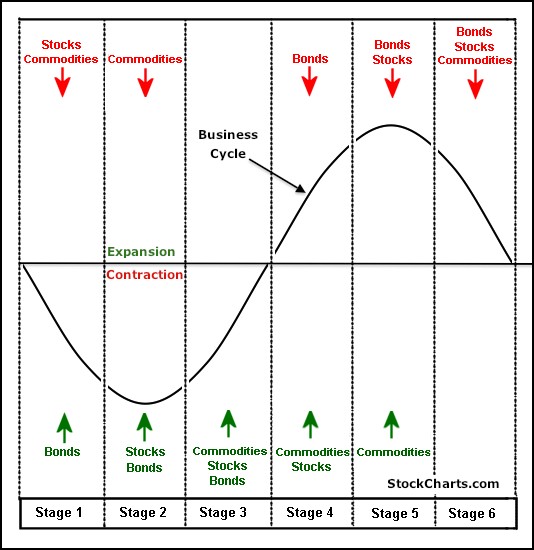
The idealized 6-stage business cycle. Green arrows (bottom) show when to buy each asset class. Red arrows (top) show when they peak. Bonds lead, then stocks, then commodities. Source: StockCharts.com
| Stage | Economy | Bonds | Stocks | Commodities |
|---|---|---|---|---|
| 1 (Early recovery) | Bottoming | Rising | Bottoming | Falling |
| 2 (Recovery) | Growing | Rising | Rising | Bottoming |
| 3 (Mid expansion) | Strong | Peaking | Rising | Rising |
| 4 (Late expansion) | Peaking | Falling | Peaking | Rising |
| 5 (Early contraction) | Slowing | Falling | Falling | Peaking |
| 6 (Recession) | Contracting | Bottoming | Falling | Falling |
Key indicators to track: yield curve (inverted = recession warning), ISM Manufacturing PMI (below 50 = contraction), unemployment claims (rising = late cycle), consumer confidence (declining = caution).
Where are we in March 2026? The U.S. economy shows mixed signals. The yield curve un-inverted in late 2024 after its longest inversion in history (July 2022 to August 2024). Historically, recessions begin 12-18 months after un-inversion, which points to a potential slowdown in 2026. The labor market has softened but not collapsed. This looks like Stage 4-5 territory: late expansion transitioning toward contraction.
Cycle 6: Sector Rotation
Timeframe: Follows the business cycle. 4-5 year full rotation.
Different stock market sectors outperform at different points in the economic cycle. This rotation is predictable because it is driven by the same underlying forces: interest rates, consumer spending, industrial demand, and commodity prices.
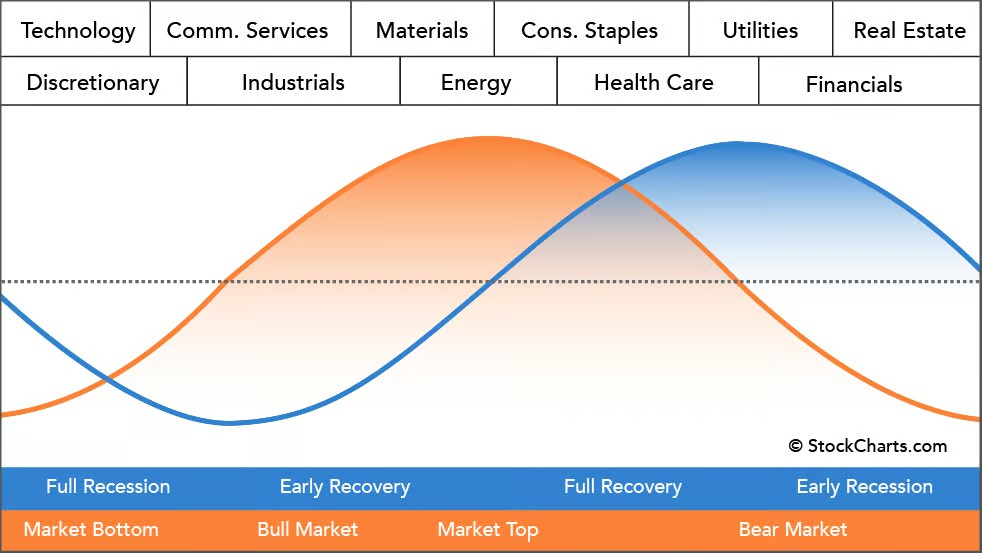
The classic sector rotation model. Technology and discretionary lead during early recovery. Energy and materials lead during late expansion. Utilities and healthcare lead during recession. The blue line represents the economy; the orange line represents the stock market (which leads by 6-9 months). Source: StockCharts.com
The rotation order (simplified):
- Full recession: Bonds outperform. Defensive sectors (utilities, healthcare, staples) hold up best.
- Early recovery: Technology and consumer discretionary lead. Financials benefit from a steepening yield curve.
- Mid expansion: Industrials and materials lead as economic activity accelerates.
- Late expansion: Energy and commodities lead as inflation picks up. Real estate peaks.
- Early recession: Rotation back to defensives. Cash and bonds outperform.
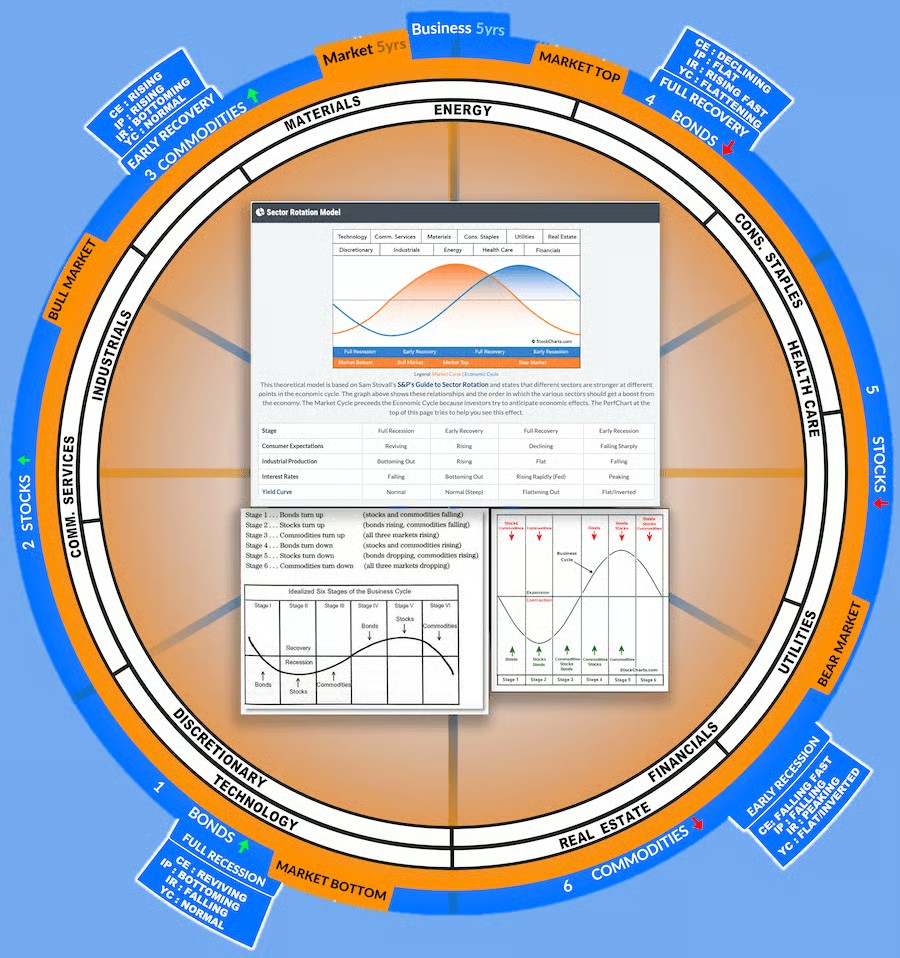
TRI’s sector rotation ring maps 20 market sectors to their position in the business and market cycle. The numbered positions (1-6) correspond to the business cycle stages. Key macro indicators (consumer expectations, industrial production, interest rates, yield curve) are shown at each phase transition.
How to use it: You do not need to trade sector ETFs directly. Use sector rotation as a filter. If sector rotation analysis says technology is in the leadership phase, focus your stock scanner on tech names. If energy is rotating into leadership, look for energy setups. This puts the wind at your back.
Cycle 7: The Emotion Cycle
Timeframe: Mirrors the market cycle. Driven by crowd psychology.
The emotion cycle maps the psychological states that investors and traders move through during a market cycle. Understanding this cycle helps you recognize when you are making decisions based on feelings rather than data.
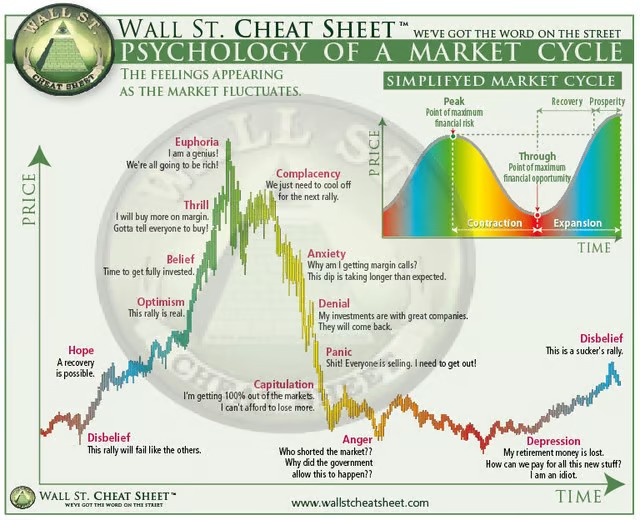
The Wall Street Cheat Sheet “Psychology of a Market Cycle.” This chart has circulated since 2009 and remains one of the most accurate depictions of how crowd sentiment shifts during bull and bear markets.
| Market Phase | Dominant Emotion | What Most People Do | What You Should Do |
|---|---|---|---|
| Bottom | Capitulation, depression, disbelief | Sell everything, swear off markets | Accumulate quietly |
| Early rally | Hope, skepticism | Stay out, call it a bear rally | Add to positions on dips |
| Mid rally | Optimism, belief | Start buying, feel smart | Hold, trail stops |
| Late rally | Thrill, euphoria | Go all-in, use leverage, tell friends | Take profits incrementally |
| Distribution | Complacency | Hold, ignore warning signs | Raise cash, tighten stops |
| Decline | Anxiety, denial | Hold, hope for recovery | Exit or hedge |
| Crash | Panic, anger, capitulation | Sell at the worst prices | Wait for stabilization, build watch list |
The practical takeaway: If you are feeling euphoric about your positions, you are probably late. If you feel terrified to buy, you are probably early. The emotion cycle is a contrarian indicator. The best trades feel uncomfortable when you enter them.
Cycle 8: The Wyckoff Cycle
Timeframe: Variable (weeks to years). Driven by institutional supply and demand.
Richard Wyckoff’s framework, developed in the 1930s, describes how large institutions (the “composite operator”) accumulate and distribute positions. The cycle has four phases that mirror the market cycle but focus specifically on volume and price structure.
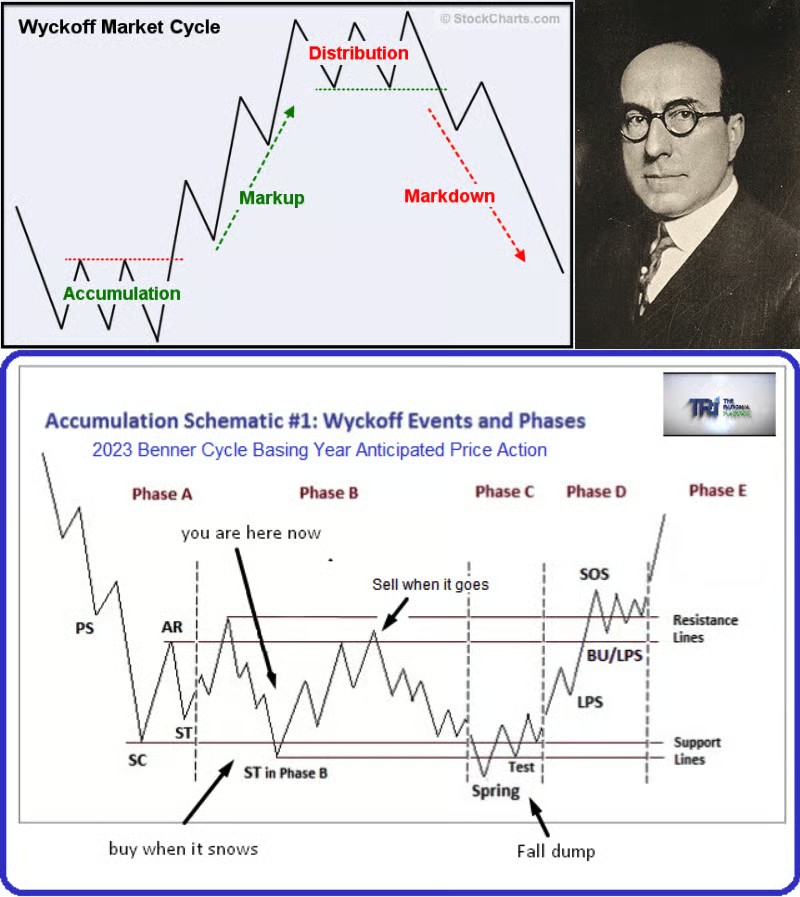
Top: The four phases of the Wyckoff cycle. Bottom: The detailed accumulation schematic showing the specific events within each phase. PS = preliminary support, SC = selling climax, AR = automatic rally, ST = secondary test, SOS = sign of strength, BU/LPS = backup/last point of support.
The four Wyckoff phases:
-
Accumulation: Smart money buys from panicked sellers. Price trades in a range. Volume spikes on the selling climax (SC) then dries up. A “spring” (false breakdown below support) traps the last sellers before markup begins.
-
Markup: The trend phase. Price makes higher highs and higher lows. Volume confirms the moves. Pullbacks are shallow and brief.
-
Distribution: Smart money sells to euphoric buyers. Price trades in a range at the top. Volume spikes on the upthrust (false breakout above resistance) then dries up. A “UTAD” (upthrust after distribution) traps the last buyers before markdown begins.
-
Markdown: The decline phase. Price makes lower lows and lower highs. Volume increases on down moves. Rallies are sold into.
How to use it: Wyckoff analysis works on any timeframe. On a daily chart, it helps identify whether a stock is being accumulated or distributed before the next major move. The key signal is the “spring” (at accumulation lows) or “upthrust” (at distribution highs) - these are the highest-probability entry points.
Cycle 9: The Bitcoin 4-Year Cycle
Timeframe: Approximately 4 years. Driven by the Bitcoin halving schedule.
Bitcoin’s halving event, which cuts the mining reward in half every 210,000 blocks (roughly every 4 years), creates a supply-driven cycle that has repeated with remarkable consistency. Each halving reduces new BTC entering the market, and each has preceded a major bull run.
| Halving | Date | Price at Halving | Cycle Peak | Return |
|---|---|---|---|---|
| 1st | Nov 2012 | ~$12 | ~$1,100 | +9,000% |
| 2nd | Jul 2016 | ~$650 | ~$19,700 | +2,930% |
| 3rd | May 2020 | ~$8,500 | ~$69,000 | +712% |
| 4th | Apr 2024 | ~$64,000 | ~$109,000* | +70%* |
*The 2024 cycle is still in progress as of March 2026. BTC trades around $70,000.
The 4-year cycle phases:
- Bottom/Accumulation (Winter): BTC trades near its cost of production. Sentiment is worst. Smart money accumulates.
- Consolidation (Spring): Recovery begins. The halving typically occurs here. Sideways to gradually up.
- Blow-off top (Summer): Parabolic rally. Media frenzy. New participants flood in at elevated prices.
- Hangover (Fall): 70-85% drawdown from peak. “Bitcoin is dead” headlines.
Where are we now? BTC hit ~$109,000 in January 2025 (9 months post-halving), then pulled back to ~$70,000 by March 2026. Whether this is a mid-cycle correction before a second leg up or the start of the bear market is the key question. The diminishing returns pattern (each cycle produces smaller percentage gains) suggests the 2024 cycle will be more modest than previous ones. The next halving is expected around March 2028.
For a deep dive on the halving cycle with charts, see our full Bitcoin halving guide.
Cycle 10: The Generational Cycle (35 Years)
Timeframe: Roughly 35 years. Driven by demographic shifts and generational attitudes toward risk.
Each generation grows up in a different economic environment, which shapes their relationship with money, debt, and investing. This creates long waves of risk appetite and risk aversion.
| Generation | Peak Earning Years | Attitude | Market Impact |
|---|---|---|---|
| Silent Gen (1928-1945) | 1960s-1980s | Conservative, savers | Low debt, stable growth |
| Baby Boomers (1946-1964) | 1980s-2010s | Optimistic, spenders | Real estate boom, 401(k) expansion, equity bull market |
| Gen X (1965-1980) | 2000s-2020s | Skeptical, cautious | Burned by dot-com and 2008, slower adoption of risk |
| Millennials (1981-1996) | 2020s-2040s | Tech-native, debt-burdened | Crypto adoption, fractional investing, meme stocks |
| Gen Z (1997-2012) | 2030s-2050s | Digital-first, short attention spans | Social media-driven markets, options boom |
The generational cycle overlaps with the Benner Cycle, which marks multi-decade periods of prosperity and depression. For more on the Benner framework and its 2026 predictions, see our Benner Cycle guide.
The Long-Term Debt Cycle (80 Years)
Timeframe: Roughly 80 years. The longest cycle that matters for investors.
The debt (or money) cycle is the macro wave that contains all other cycles. It tracks the long-term expansion and contraction of credit in the economy. Ray Dalio’s research popularized this concept: economies go through a roughly 80-year cycle of borrowing, leveraging, deleveraging, and rebuilding.
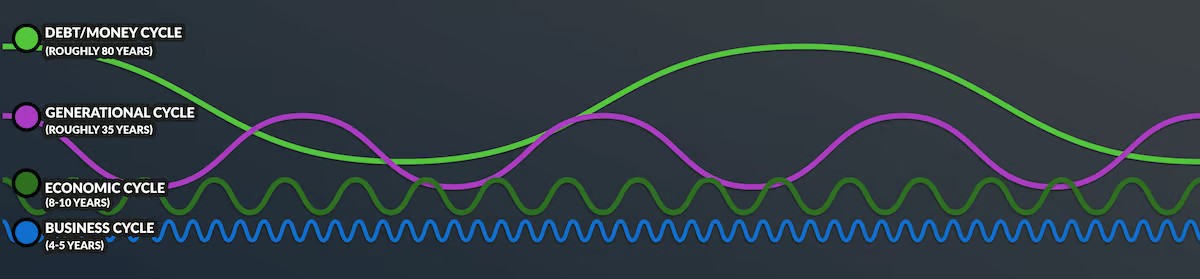
How the four longest cycles nest together. The 80-year debt cycle (green) is the slowest wave. Inside it, the 35-year generational cycle (purple) oscillates. Inside that, the 8-10 year economic cycle (dark green) and 4-5 year business cycle (blue) create the shorter-term fluctuations traders interact with daily.
| Phase | Duration | Characteristics | Last Occurrence |
|---|---|---|---|
| Early expansion | ~20 years | Debt is low, growth is high, optimism builds | 1945-1965 |
| Late expansion | ~20 years | Debt accelerates, asset prices inflate, inequality grows | 1965-2000 |
| Bubble/peak | ~10 years | Debt reaches unsustainable levels, speculation rampant | 2000-2008 |
| Deleveraging | ~10-20 years | Debt is restructured, defaults rise, central banks intervene | 2008-present |
Where are we now? The U.S. national debt exceeds $36 trillion (March 2026). The Fed’s balance sheet, while reduced from its 2022 peak, remains historically elevated. Interest expense on government debt now exceeds defense spending. By most measures, we are in the late deleveraging phase of an 80-year cycle that began after World War II. This does not mean an imminent crash, but it means the structural tailwinds that supported the 1982-2000 bull market (declining rates, expanding credit) are largely exhausted.
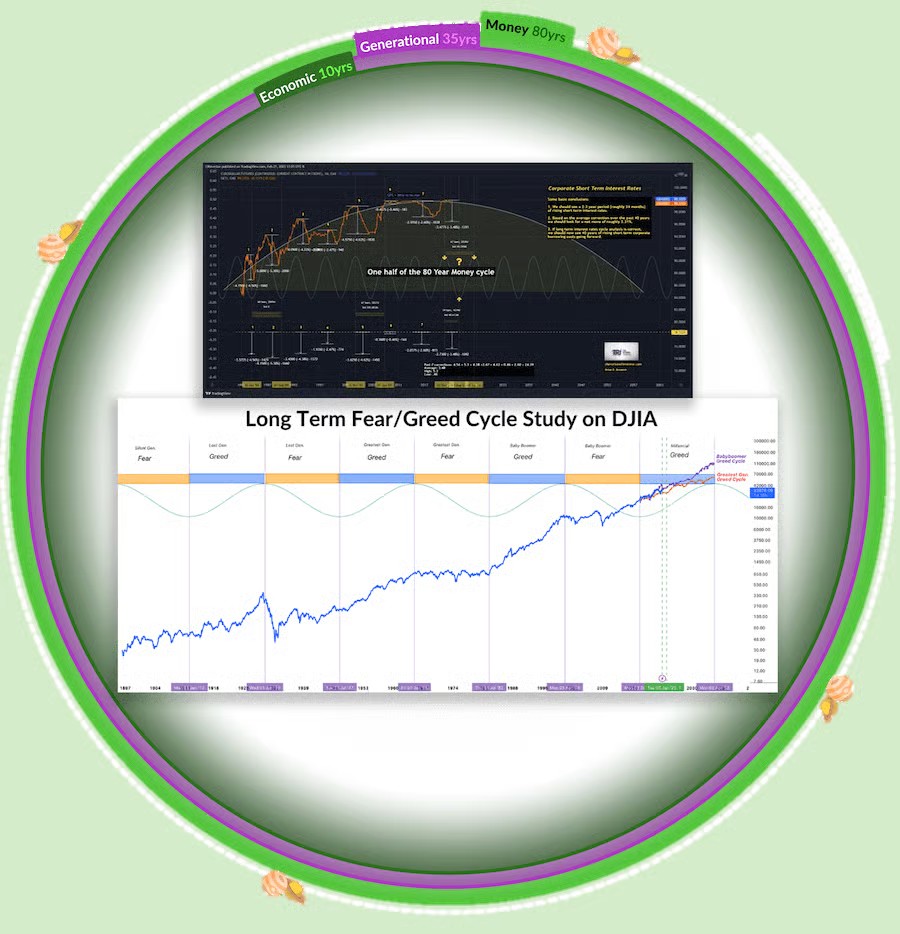
Top: The 80-year corporate interest rate cycle, currently approaching the end of a long declining rate era. Bottom: Long-term DJIA overlaid with generational fear and greed phases. Each generation alternates between risk-seeking (greed) and risk-averse (fear) behavior, creating 35-year waves within the 80-year debt supercycle.
How All 10 Cycles Work Together
No single cycle tells the whole story. The power of cycle analysis comes from stacking multiple timeframes and looking for convergence.
Example: A high-conviction long setup
- Daily cycle: London session breakout (kill zone entry)
- Weekly cycle: Friday close above the 20-week high
- Seasonality: November (historically strong month)
- Market cycle: Markup phase (bull market)
- Business cycle: Stage 2-3 (economic recovery/expansion)
- Sector rotation: Technology in leadership
- Emotion cycle: Optimism (not euphoria yet)
- Wyckoff: Price just broke out of an accumulation range
- Bitcoin: 12 months post-halving, spring/summer phase (if trading crypto)
- Debt cycle: Accommodative monetary policy
When 5 or more of these cycles align, you have a high-probability environment. When they conflict (e.g., bearish seasonality but bullish business cycle), you reduce size or step aside.
The key principle: Higher timeframe cycles override lower timeframe cycles. If the business cycle is in contraction (Stage 5-6), even the best daily chart setup is fighting the current. If the debt cycle is in deleveraging mode, even strong business cycle recoveries may be shallower than historical averages.
How to Track Cycles Practically
You do not need to monitor all 10 cycles in real time. Here is a practical approach:
| Frequency | What to Check | Why |
|---|---|---|
| Daily | Kill zones, weekly chart levels | Timing entries and exits |
| Weekly | Weekly candle close, sector relative strength | Swing trade direction |
| Monthly | Seasonality calendar, sector rotation phase | Position bias (long, short, or cash) |
| Quarterly | Business cycle indicators (PMI, yield curve, unemployment) | Risk appetite adjustment |
| Yearly | Generational trends, debt cycle position, Bitcoin halving countdown | Portfolio allocation strategy |
Tools that help:
- Sector rotation: compare sector ETF performance (XLK, XLE, XLF, etc.) on a relative strength basis
- Business cycle: Conference Board Leading Economic Indicators, ISM PMI, yield curve
- Seasonality: EquityClock.com, Stock Trader’s Almanac
- Bitcoin cycle: halving countdown, on-chain metrics (MVRV, SOPR, realized price)
- Emotion: CNN Fear and Greed Index, AAII Sentiment Survey, VIX level
Frequently Asked Questions
What are the main market cycles? The 10 primary market cycles are: daily (kill zones), weekly, seasonality (12-month), market cycle (4-5 years), business cycle (4-5 years), sector rotation, emotion cycle, Wyckoff cycle, Bitcoin 4-year halving cycle, generational cycle (35 years), and the long-term debt/money cycle (80 years). Each operates on a different timeframe, and they all interact with each other.
What stage of the market cycle are we in? As of March 2026, the picture is mixed. The S&P 500 remains below its 2025 highs. The business cycle appears to be in late Stage 4 or early Stage 5 (late expansion transitioning toward potential contraction). The yield curve un-inverted in late 2024, which historically precedes recession by 12-18 months. Bitcoin is in the mid-to-late phase of its 2024 halving cycle. Seasonally, Q2 2026 enters the historically weaker May-October period.
How do you use market cycles for trading? Use longer cycles to set your bias (bullish, bearish, or neutral) and shorter cycles to time entries. For example, if the business cycle is in expansion (bullish) and seasonality is favorable (bullish), look for daily chart entries using Wyckoff accumulation patterns or kill zone timing. When cycles conflict, reduce position size or wait.
What is the Wyckoff cycle? The Wyckoff cycle describes how institutional investors accumulate (buy) and distribute (sell) large positions. It has four phases: accumulation, markup, distribution, and markdown. The key signals are the “spring” (false breakdown below support, signaling accumulation is complete) and “upthrust” (false breakout above resistance, signaling distribution is complete).
What is sector rotation? Sector rotation is the predictable shift in which stock market sectors outperform during different phases of the business cycle. Technology and consumer discretionary lead during recoveries, energy and materials lead during late expansion, and utilities and healthcare lead during recessions. Tracking rotation helps you focus on sectors with the wind at their back.
How long do market cycles last? It varies by cycle type. Daily cycles repeat every 24 hours. Weekly cycles every 5 trading days. Seasonality repeats annually. The market and business cycles average 4-5 years. The economic cycle averages 8-10 years. The generational cycle is roughly 35 years. The debt supercycle is approximately 80 years. No two cycles of the same type are exactly the same length.