The Sector Rotation Model: How Smart Money Positions for Each Phase of the Business Cycle
Sector rotation is the predictable movement of money between stock market sectors as the economy cycles through expansion, peak, contraction, and trough. By identifying the current business cycle phase, investors can tilt toward sectors most likely to outperform.
What Is Sector Rotation?
Sector rotation is the movement of money between stock market sectors as the economy moves through different phases of the business cycle. At any given time, some sectors are outperforming the broad market while others are underperforming. This rotation is not random. It follows a predictable pattern tied to economic conditions.
The theory comes from Sam Stovall’s S&P’s Guide to Sector Rotation and has been validated across decades of market data. The core idea: different sectors are strongest at different points in the economic cycle. If you can identify where you are in the cycle, you can tilt your portfolio toward the sectors most likely to outperform.
This is not a trading signal. It is a framework for understanding where institutional money is flowing, which helps you focus on the right areas of the market and avoid the wrong ones.
The Business Cycle and Sector Leadership
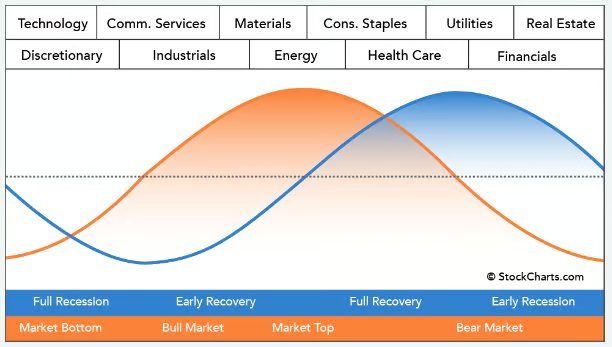
The economy moves through four broad phases, and each phase has consistent sector winners and losers. This diagram from StockCharts shows the complete rotation:
The Stovall sector rotation model. The blue line represents the stock market cycle. The orange line represents the economic cycle. Sectors at the top show which groups lead during each phase.
Phase 1: Market Bottom and Early Recovery
The economy is in recession or just coming out of one. Interest rates are falling or low. The Federal Reserve is easing monetary policy.
| Leading Sectors | Why They Lead |
|---|---|
| Technology | Benefits from low rates; growth becomes attractive as recovery begins |
| Consumer Discretionary | Consumers start spending again as confidence returns |
| Communication Services | Ad spending recovers; growth-oriented companies benefit from low rates |
| Industrials | Anticipation of infrastructure spending and manufacturing rebound |
This is where the biggest gains are made. Buying beaten-down cyclical sectors during a recession (when sentiment is worst) historically produces the strongest returns over the following 12-18 months.
Phase 2: Mid-Cycle Expansion
The economy is growing. Corporate earnings are rising. Employment is strong. This is the longest phase of the cycle.
| Leading Sectors | Why They Lead |
|---|---|
| Industrials | Manufacturing and capital spending accelerate |
| Materials | Rising demand for raw materials from construction and production |
| Technology | Earnings growth continues to attract capital |
Mid-cycle is where most investors feel comfortable. The danger is complacency: the easy money has already been made, and the cycle is aging.
Phase 3: Late Cycle and Market Top
The economy is still growing but slowing. Inflation is rising. The Fed is tightening (raising rates). Corporate margins are being squeezed by higher input costs and wages.
| Leading Sectors | Why They Lead |
|---|---|
| Energy | Benefits from rising commodity prices and inflation |
| Consumer Staples | Defensive; people still buy food, household goods, and medicine |
| Health Care | Defensive; healthcare spending is non-discretionary |
| Materials | Commodity prices peak during late-cycle inflation |
This is where experienced investors start getting defensive. The market may still be making new highs, but leadership is rotating away from growth and into value and defensive names.
Phase 4: Early Recession and Bear Market
The economy is contracting. Earnings are declining. The Fed is cutting rates (or about to). Fear is the dominant emotion.
| Leading Sectors | Why They Lead |
|---|---|
| Utilities | Bond proxies; benefit from falling interest rates |
| Consumer Staples | Recession-proof demand (food, beverages, household products) |
| Health Care | Non-discretionary spending continues regardless of economy |
| Real Estate | Benefits from falling rates (eventually) |
| Financials | Anticipate rate cuts and future recovery |
The sectors that led during the expansion (tech, discretionary, industrials) get hit hardest during recession. The sectors that lagged during the boom (utilities, staples) become relative outperformers.
How to Read the Sector Rotation Model
The model is a framework, not a crystal ball. Here is how to apply it practically:
Step 1: Identify the Current Business Cycle Phase
Use these indicators to assess where the economy sits:
| Indicator | Early Recovery | Mid-Cycle | Late Cycle | Recession |
|---|---|---|---|---|
| GDP growth | Accelerating from negative | Steady positive | Slowing | Negative |
| Interest rates | Low / falling | Rising slowly | Rising fast | Falling |
| Inflation | Low | Moderate | High / rising | Falling |
| Yield curve | Steepening | Normal | Flattening / inverting | Inverted then steepening |
| Employment | Improving | Strong | Tight labor market | Rising unemployment |
| Fed policy | Easing | Neutral | Tightening | Easing |
| Corporate earnings | Recovering | Growing | Peaking | Declining |
No single indicator tells the full story. When multiple indicators point to the same phase, the signal is stronger.
Step 2: Check Which Sectors Are Leading
Use the free StockCharts Sector Performance tool to see real-time relative performance of all 11 S&P 500 sectors.
To set up the chart:
- Open the link above
- Click “Show Histogram Chart”
- Right-click the chart and select “Lock Y Axis”
- Change the timeframe to match your analysis period (first 2 weeks of the quarter, full quarter, or year-to-date)
This shows you exactly where money is flowing right now.
Step 3: Compare Sector Leadership to the Model
If energy, staples, and healthcare are leading while technology and discretionary are lagging, the model suggests late-cycle conditions. If technology and discretionary are leading while utilities and staples lag, the model suggests early recovery or mid-cycle expansion.
The key question is always: does today’s sector leadership match the business cycle phase that other indicators are pointing to? When they align, the signal is strong. When they conflict, something unusual may be happening (policy intervention, external shock, or a transition between phases).
The First-Two-Weeks Methodology
One of the most practical applications of sector rotation is studying the first two weeks of each quarter. This is the window when large institutional investors, particularly pension funds and endowments, allocate capital for the quarter.
Why the First Two Weeks Matter
Pension funds manage trillions of dollars and employ large research departments. Their quarterly allocation decisions reflect where they believe the economy is headed. By studying which sectors receive the most capital in the first two weeks, you get a read on institutional sentiment.
How to Use It
- At the start of each quarter (January, April, July, October), wait for the first 10 trading days to complete
- Pull up the StockCharts performance tool and set the date range to those 10 days
- Note which sectors are strongest and which are weakest
- Compare the pattern to the sector rotation model
If the first two weeks show utilities and staples leading, institutions are positioning defensively. If tech and discretionary lead, they are positioning for growth. This gives you a forward-looking signal about where professional money managers expect the economy to go.
Limitations
- Holiday-shortened weeks (particularly Q3, which starts near July 4th) can skew the data
- One quarter’s signal can conflict with the previous quarter, indicating a transition period
- The signal is probabilistic, not guaranteed. Sometimes the first two weeks reverse by quarter’s end
Use this as one input alongside other economic indicators, not as a standalone trading trigger.
S&P 500 Sector ETFs: The Toolkit
Each of the 11 S&P 500 sectors has a corresponding SPDR ETF that lets you trade the rotation directly:
| Sector | ETF | Key Holdings | Cycle Phase |
|---|---|---|---|
| Technology | XLK | AAPL, MSFT, NVDA | Early recovery, mid-cycle |
| Consumer Discretionary | XLY | AMZN, TSLA, HD | Early recovery |
| Communication Services | XLC | META, GOOG, NFLX | Early recovery, mid-cycle |
| Industrials | XLI | CAT, UNP, HON | Mid-cycle |
| Materials | XLB | LIN, APD, FCX | Mid-cycle, late cycle |
| Energy | XLE | XOM, CVX, COP | Late cycle |
| Consumer Staples | XLP | PG, KO, COST | Late cycle, recession |
| Health Care | XLV | UNH, JNJ, LLY | Late cycle, recession |
| Utilities | XLU | NEE, SO, DUK | Recession |
| Financials | XLF | BRK.B, JPM, V | Recession (late), early recovery |
| Real Estate | XLRE | PLD, AMT, EQIX | Recession (late), early recovery |
You do not need to trade sector ETFs to benefit from this model. Even if you trade individual stocks, knowing which sectors the model favors helps you focus your scans and setups on the areas with the strongest institutional tailwinds.
Case Study: How Sector Rotation Played Out in 2022-2023
The 2022-2023 period provides a textbook example of sector rotation in action.
Q1 2022: Late-Cycle Leadership
Energy dominated, gaining over 40% in Q1 2022 while technology, communication services, and discretionary all declined. This was classic late-cycle behavior: inflation was surging, the Fed was beginning to raise rates aggressively, and commodity prices were spiking.
The sector rotation model correctly identified late-cycle conditions. Investors positioned in energy and staples outperformed dramatically.
Q3 2022: A Dead-Cat Bounce
By Q3 2022, technology and discretionary briefly led, suggesting early recovery. But this contradicted other indicators: the Fed was still raising rates, inflation was still elevated, and the yield curve was deeply inverted.
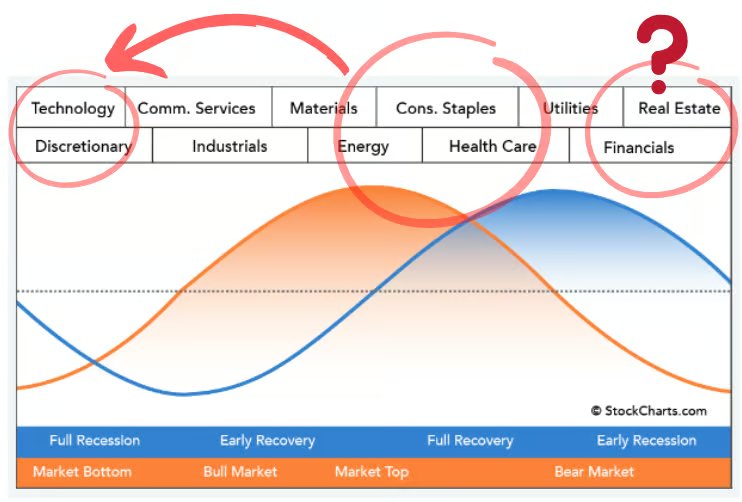
The sector rotation model annotated during Q3 2022. Technology and discretionary leadership (red circle, left) would imply early recovery, but the economy was clearly in late-cycle/early recession territory (red circle, right). The conflicting signal suggested a dead-cat bounce, not a genuine recovery.
The sector signal conflicted with economic reality. This turned out to be a temporary bounce in beaten-down tech stocks, not a genuine phase transition. Technology and discretionary resumed their decline in Q4 2022, and the bear market continued.
Q4 2023: Defensive Rotation
By Q4 2023, utilities showed the most strength in the first-two-weeks study. Combined with an inverted yield curve (a reliable recession indicator), this pointed to early recession conditions. While a full recession never materialized (the economy proved more resilient than expected), the defensive positioning was rational given the data available at the time.
The lesson: The model does not predict the future with certainty. It tells you the probability-weighted positioning based on current data. When the model says “late cycle” and you position defensively, you may occasionally miss a rally. But you will also avoid the catastrophic losses that come from being fully invested in cyclical sectors when the recession actually hits.
Where Are We Now? Q1 2026 Sector Rotation
As of March 2026, the sector rotation data shows a significant shift that institutional investors are calling “The Great Rotation”:
| Sector | 2026 YTD | Signal |
|---|---|---|
| Energy (XLE) | Leading (+25% YTD) | Late-cycle / inflation hedge |
| Materials (XLB) | Leading (+18% YTD) | Late-cycle / commodity demand |
| Industrials (XLI) | Strong (+16% YTD) | Mid-to-late cycle |
| Consumer Staples (XLP) | Strong (+13% YTD) | Defensive positioning |
| Health Care (XLV) | Outperforming S&P | Defensive positioning |
| Utilities (XLU) | Outperforming S&P | Defensive / rate-sensitive |
| Technology (XLK) | Underperforming | Growth rotation ending |
| Consumer Discretionary (XLY) | Underperforming | Consumer caution |
| Communication Services (XLC) | Underperforming | Growth rotation ending |
| Financials (XLF) | Underperforming | Relative weakness despite absolute uptrend |
What the Model Says
The leadership of energy, materials, staples, and healthcare with weakness in technology and discretionary is a textbook late-cycle pattern. The S&P 500 is roughly flat YTD, but the average stock is performing much better than the index suggests because the mega-cap tech stocks that dominate the index are dragging it down.
This rotation echoes early 2022, when energy led and tech lagged before the bear market deepened. It does not guarantee a recession is imminent, but it does suggest that institutional money is positioning defensively.
How to Apply This
- Tilt scans toward leading sectors. If you are looking for swing trading setups, energy, materials, industrials, and staples are where institutional money is flowing.
- Be cautious with lagging sectors. Technology and discretionary stocks are fighting institutional headwinds. Setups in these sectors need to be stronger to overcome the rotation.
- Watch for phase transitions. If utilities and staples start dramatically outperforming everything else, the model would shift from “late cycle” to “early recession.” If tech and discretionary suddenly reclaim leadership, it could signal a new expansion phase.
- Revisit at the start of Q2 2026 (April). Run the first-two-weeks study to see if the rotation continues or reverses.
Common Mistakes When Using Sector Rotation
| Mistake | Why It Costs You | How to Avoid It |
|---|---|---|
| Using it as a standalone signal | Sector rotation is one input, not a complete system | Combine with technical analysis, macro data, and your trading plan |
| Ignoring conflicting signals | When sectors say “recovery” but the yield curve says “recession,” something is off | Wait for multiple indicators to align before committing |
| Over-rotating | Switching sectors every week based on short-term noise | Use quarterly analysis (first-two-weeks study), not daily performance |
| Fighting the rotation | Buying tech “because it’s cheap” when the model says late cycle | Respect the cycle; sectors can underperform for quarters |
| Assuming perfect timing | The model shows tendencies, not exact turning points | Position gradually; don’t go all-in on a single sector |
Frequently Asked Questions
What is sector rotation in the stock market?
Sector rotation is the shift of investment capital between stock market sectors as the economy moves through business cycle phases. Different sectors outperform during different economic conditions. Technology and consumer discretionary lead during recovery, energy and staples lead during late cycle, and utilities and healthcare lead during recession. Institutional investors rotate between sectors to position ahead of economic changes.
Which sectors do best in a recession?
Defensive sectors historically outperform during recessions: utilities, consumer staples, and healthcare. These sectors sell products and services that people need regardless of economic conditions (electricity, food, medicine). Utilities also benefit from falling interest rates, which typically accompany recessions as the Federal Reserve cuts rates to stimulate the economy.
Which sectors lead during a bull market?
Technology, consumer discretionary, communication services, and industrials historically lead during the early and mid-cycle phases of a bull market. These cyclical sectors benefit from economic growth, rising corporate earnings, and increased consumer and business spending. The strongest bull market gains typically come from buying these sectors near the bottom of a recession, when they are most out of favor.
How do you identify the current business cycle phase?
Use a combination of indicators: GDP growth trends, Federal Reserve interest rate policy, inflation data (CPI/PCE), the yield curve shape (steep vs. inverted), employment trends, and corporate earnings growth. When multiple indicators point to the same phase, the signal is reliable. You can also use the first-two-weeks-of-the-quarter methodology to see where institutional money is flowing in real time.
Can individual stock traders use sector rotation?
Yes. You do not need to trade sector ETFs. Knowing which sectors the model favors helps you focus your stock scans on the right areas. If the rotation model points to late-cycle conditions, prioritize setups in energy, staples, and healthcare stocks. Avoid fighting institutional headwinds by chasing setups in sectors that are rotating out of favor.
How often should I check sector rotation?
Quarterly is the most practical cadence for most traders. Run the first-two-weeks analysis at the start of each quarter and compare the results to the business cycle model. Monthly check-ins can catch transitions, but weekly or daily sector performance is too noisy to be useful for rotation analysis.
Next Steps
- Pull up the sector performance chart and see where money is flowing right now: StockCharts Sector Performance
- Learn the broader market cycles that drive sector rotation: 10 Market Cycles Every Trader Should Know
- Build a trading plan that incorporates sector analysis into your setup criteria: How to Make a Trading Plan
- Understand the Benner Cycle for longer-term economic timing: The Benner Cycle: 100+ Years of Market Predictions
- Join the TRI community for daily macro briefs that include sector analysis: Join Free
Sources
- Sam Stovall, S&P’s Guide to Sector Rotation (McGraw-Hill)
- StockCharts: Sector Rotation Analysis
- Fidelity: The Business Cycle Approach to Equity Sector Investing
- Morningstar: Is a Stock Market Rotation Underway? (March 2026)
- StockCharts: 2026 Starts With a Big Rotational Change
This guide is for educational purposes only. Sector rotation is a framework for understanding market dynamics, not a guaranteed predictor of future performance. Past sector leadership patterns do not guarantee future results. Always combine sector analysis with your own risk management rules.